Nahtlose Nutzung von Microsoft Power BI Embedded
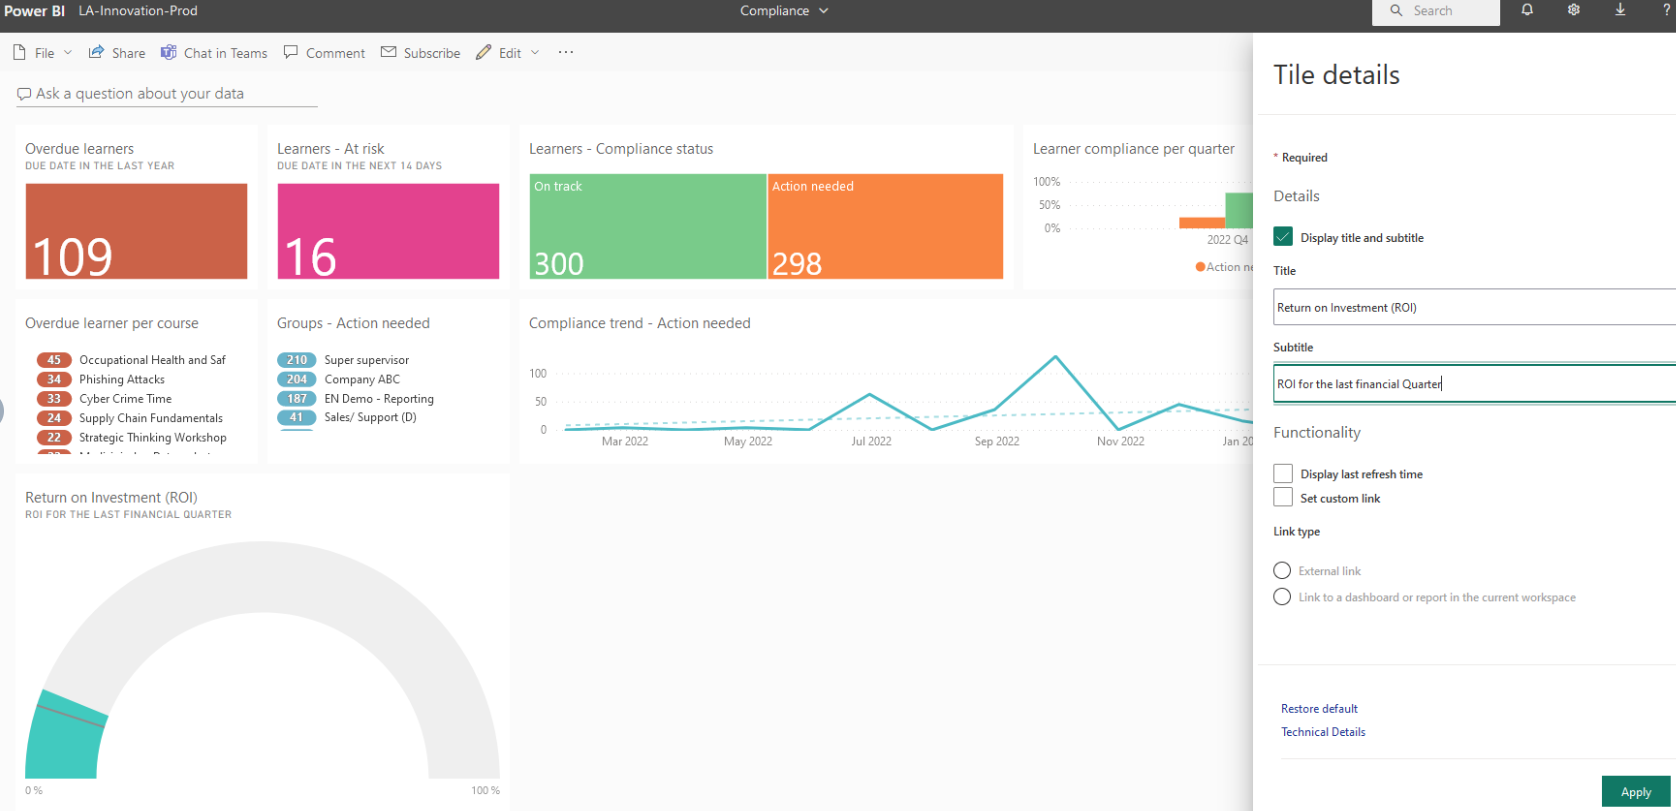
Nutzer mit entsprechenden Zugriffsrechten zum Bearbeiten oder Duplizieren eines Reports können die gesamte Leistungsfähigkeit von Microsoft Power BI Embedded nahtlos in der imc Learning Suite nutzen, ohne sich zusätzlich anmelden zu müssen. Power BI wird auf der rechten Seite neben dem Report aus imc Learning Analytics geöffnet, siehe folgende Abbildung.
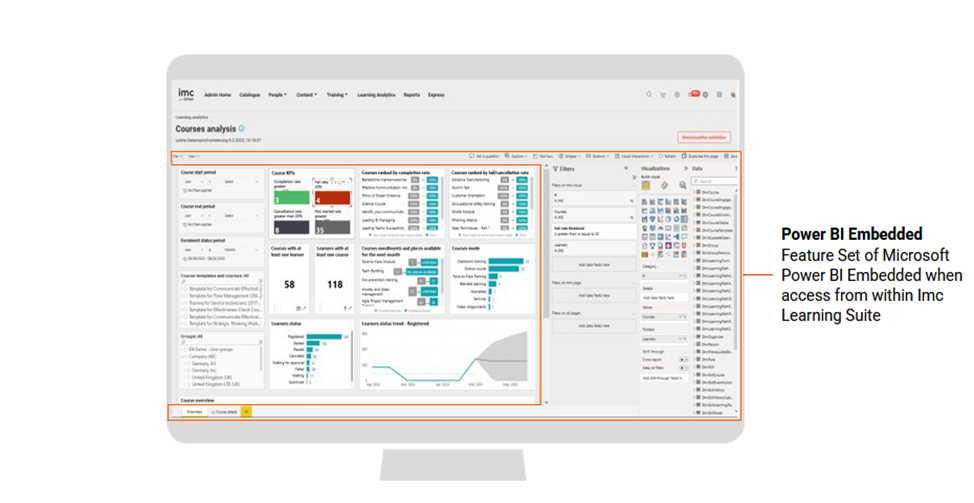
Als Überblick bieten sich in diesem Zusammenhang folgende Möglichkeiten von Microsoft Power BI an:
Filter ändern oder zusätzliche Filter anwenden
Der Nutzer kann Filter ändern oder hinzufügen, indem er sich auf das von imc Learning Analytics bereitgestellte Datenmodell bezieht. Beispielsweise können bestimmte von Scheer IMC in den Standard-Reports bereitgestellte Leistungskennzahlen durch Ändern des Filtergrenzwerts an Ihre Anforderungen angepasst werden.
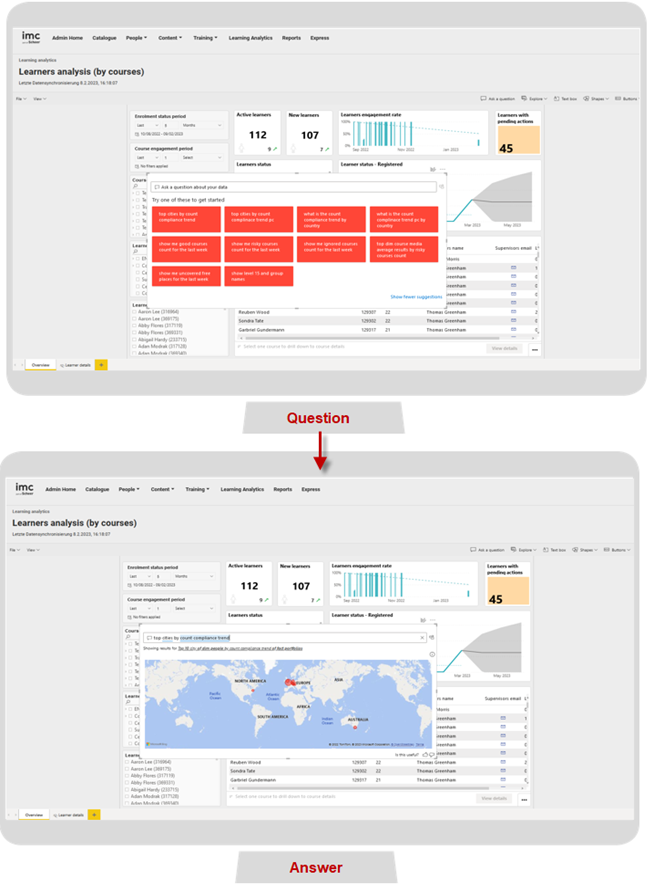
„Eine Frage stellen“
Diese Microsoft Power BI-Funktion bietet Ihnen die Möglichkeit, eine Freitextfrage einzugeben, die Sie anhand der gemeldeten Daten beantworten möchten, oder einen der Fragenvorschläge auszuwählen, die Microsoft Power BI automatisch generiert hat. Das folgende Beispiel basiert auf dem Standardreport „Lerneranalyse (nach Kursen)” von imc Learning Analytics. (siehe folgende Abbildung).
Filterbereich
Möglichkeit, Filter pro Report, pro Seite oder pro Report-Darstellung zu ändern oder hinzuzufügen, wobei auf die verfügbaren Daten im Datenbereich auf der rechten Seite Bezug genommen wird.
Visualisierungen
Bietet Zugriff auf eine Vielzahl von Statistik-Optionen, die in den Reports von imc Learning Analytics verwendet werden können. Darüber hinaus kann die Canvasgröße pro Seite definiert werden.
Daten
Ermöglicht den Zugriff auf alle von Scheer IMC bereitgestellten Datentabellen mit imc Learning Analytics. Dies kann für die eigene Definition von Visualisierungen, Metriken, Übersichts-Listen usw. oder sogar für die Erstellung eines komplett neuen Reports verwendet werden.
Hinweise zu Microsoft Power BI
Dieser Abschnitt enthält Details zu den allgemeinen Funktionen, die in Microsoft Power BI Service verfügbar sind. Diese Funktionen werden nicht von Scheer IMC, sondern von Microsoft bereitgestellt und sind in diesem Dokument zu Informationszwecken aufgeführt.
Zeitplanung der Datenaktualisierung
Bei imc Learning Analytics werden Daten über ETL-Prozesse aus der produktiven Datenbank der imc Learning Suite in die Datenbank von imc Learning Analytics übertragen. Die Zeitplanung dieser Synchronisierung kann pro Kunde vorgenommen werden. Es ist auch möglich, eine Aktualisierung manuell über die Desktop-App von Microsoft Power BI durch den Kundenadministrator von imc Learning Analytics mit der von Scheer IMC mit dem Service bereitgestellten Power BI Premium-Lizenz auszulösen.
Bitte beachten Sie automatische Aktualisierung wird automatisch angehalten werden, wenn keiner der Reports oder Portale im Power BI-Arbeitsbereich des Kunden in den letzten zwei Monaten aufgerufen wurde.
Um dies zu vermeiden, wird empfohlen, mindestens einmal alle zwei Monate einen der Reports oder das Portal im Power BI-Arbeitsbereich aufzurufen, um sicherzustellen, dass die automatische Aktualisierung des semantischen Modells von imc Learning Analytics nicht von Microsoft Power BI angehalten wird.
Integration externer Daten
Power BI unterstützt die Integration externer Daten aus einer Vielzahl externer Datenquellen. Einen Screenshot der Anwendung finden Sie in der folgenden Abbildung.
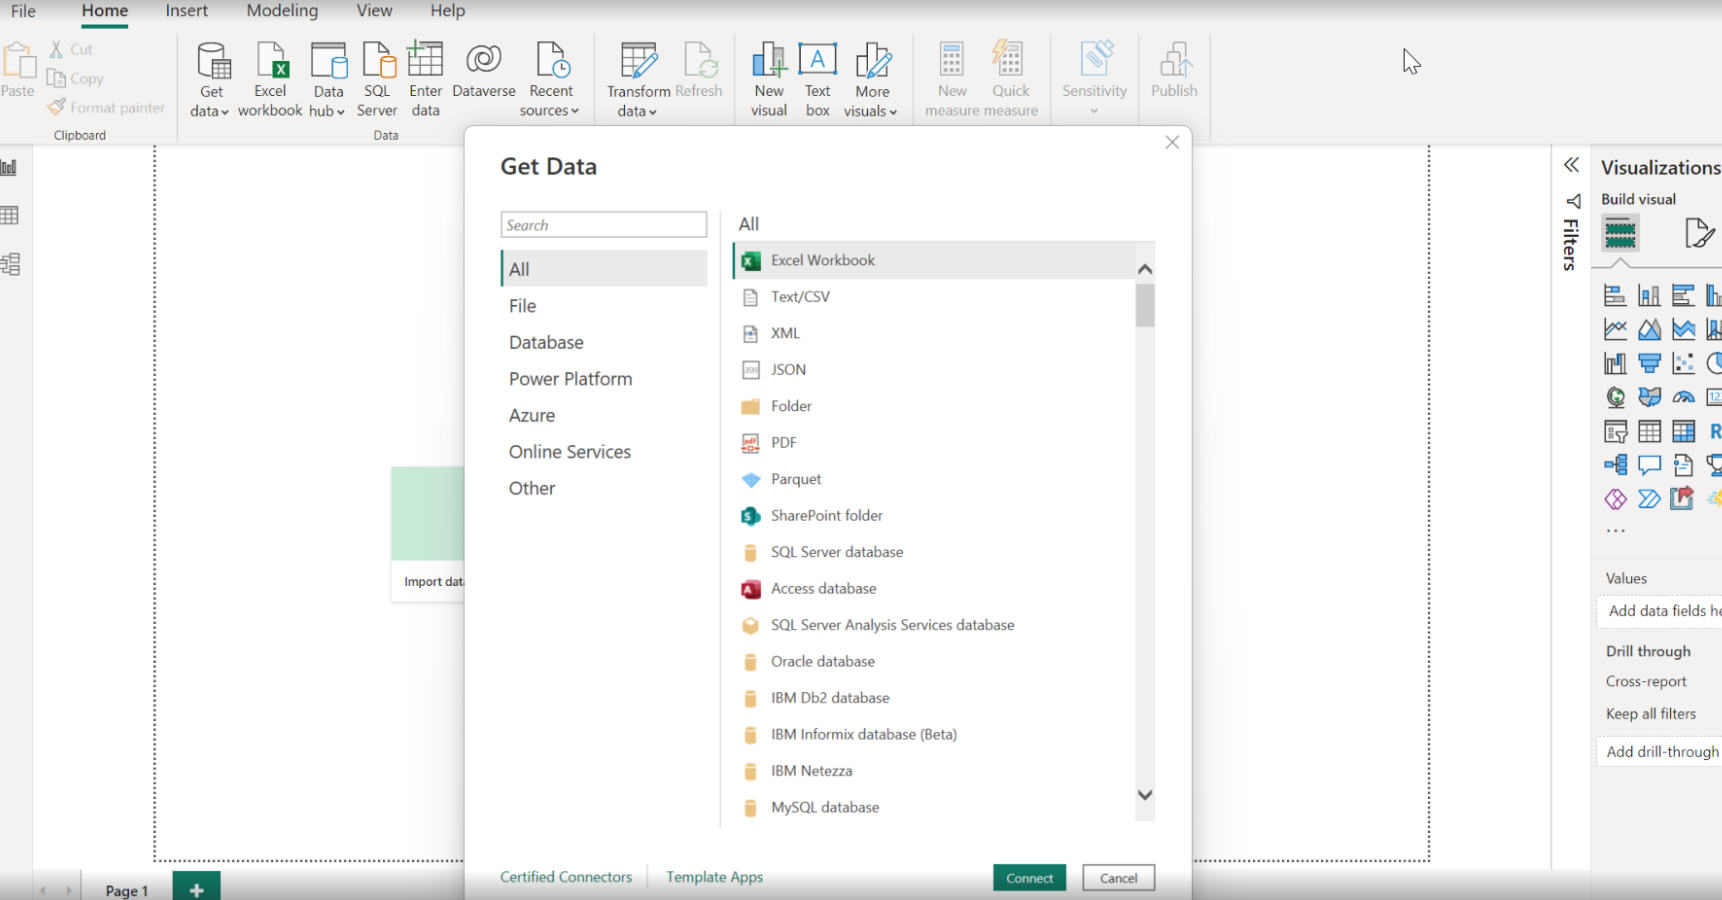
Eine vollständige Liste der unterstützten Datenformate finden Sie unter Power BI-Datenquellen.
Es sind weitere Schritte erforderlich, um die Daten der ausgewählten Ressourcen in Microsoft Power BI für die Berichterstellung effektiv zu nutzen und den Report im Rahmen von imc Learning Analytics zu veröffentlichen und zu verwenden. Diese Schritte werden im Folgenden kurz beschrieben.
-
ETL-Prozesse müssen für die nominierte Zielquelle definiert werden, um das gewünschte Daten-Tabellenlayout in Microsoft Power BI zu erreichen. Anschließend können die Daten importiert und für die Erstellung von Reports in Power BI verwendet werden.
-
Ein Report, der für die Verwendung in imc Learning Analytics vorgesehen ist, muss eingerichtet und im Microsoft Power BI-Arbeitsbereich unter Verwendung des Microsoft Power BI Premium-Kontos veröffentlicht werden, das von Scheer IMC in den imc Learning Analytics-Diensten enthalten ist. (Bitte beachten Sie, dass es nicht möglich ist, bestehende Microsoft Power BI-Konten zu verwenden). Wenn die Systemlandschaft mehr als eine Systeminstanz umfasst, kann das Ziel für die Veröffentlichung des Reports innerhalb von Microsoft Power BI ausgewählt werden. Folgende Abbildung enthält ein Beispiel.

-
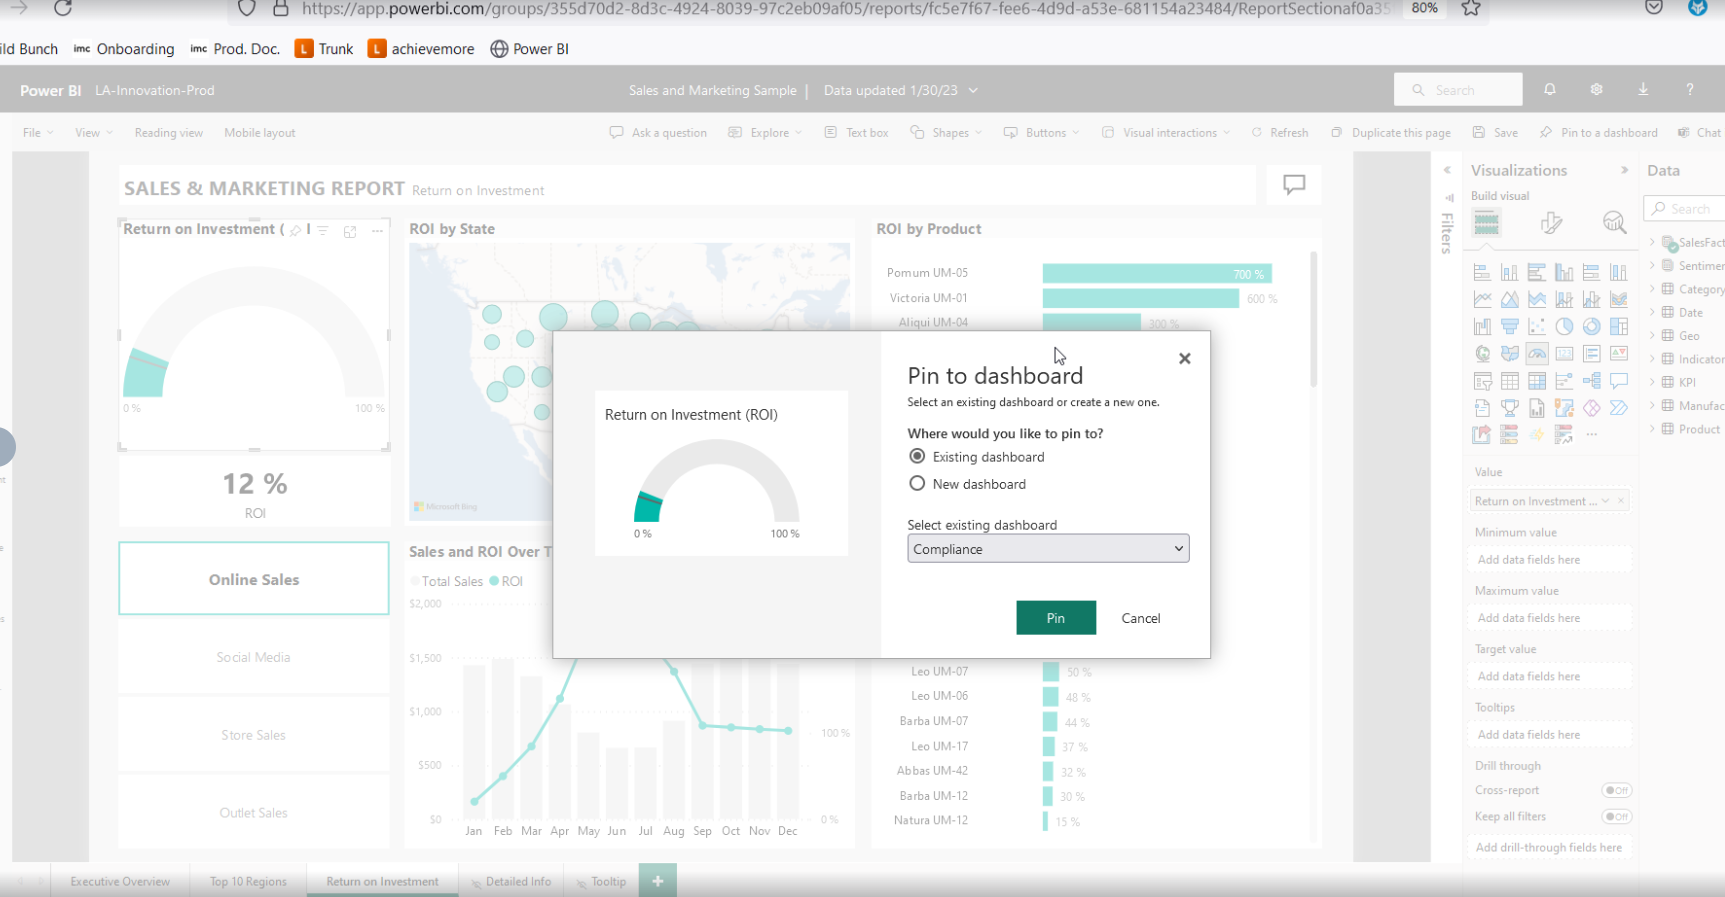
Als nächster Schritt kann auf den Report über Power BI-Dienst innerhalb des Arbeitsbereichs zugegriffen werden, in dem er veröffentlicht wurde. Der generierte Report kann im Modus zum Bearbeiten geöffnet werden, und der Nutzer kann aus diesem Report Visualisierungen auswählen, die auf einem Microsoft Power BI-Portal angeheftet werden sollen. Siehe den folgenden Screenshot des entsprechenden Dialogs in Microsoft Power BI.
-
Angeheftete Grafiken können nach Bedarf in einem Portal-Layout angeordnet werden.
-
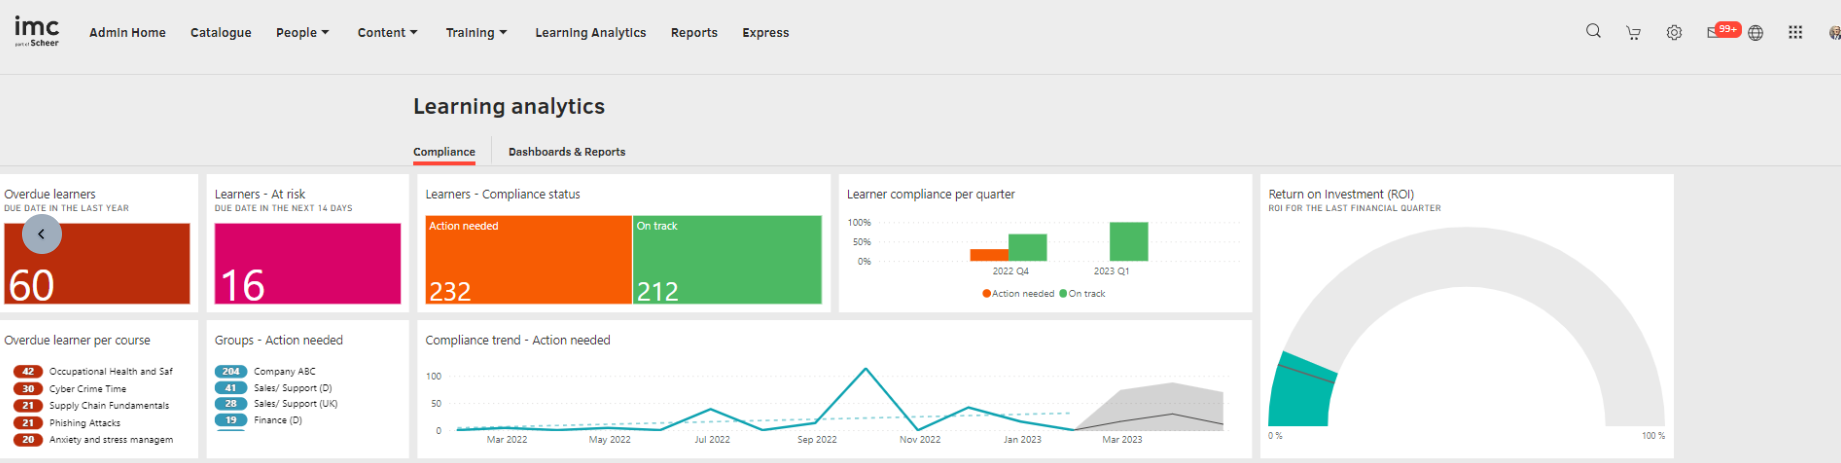
Das Portal wird automatisch in der imc Learning Suite innerhalb des LA-Managers aktualisiert und Personen mit definierten Zugriffsrechten in der LMS angezeigt, wie in der folgenden Abbildung dargestellt.
Abonnement
Um über die wichtigsten Dashboards und Reports auf dem Laufenden zu bleiben, kann sich der Power BI-Nutzer in Power BI Service für Power BI-Reports und -Dashboards anmelden.
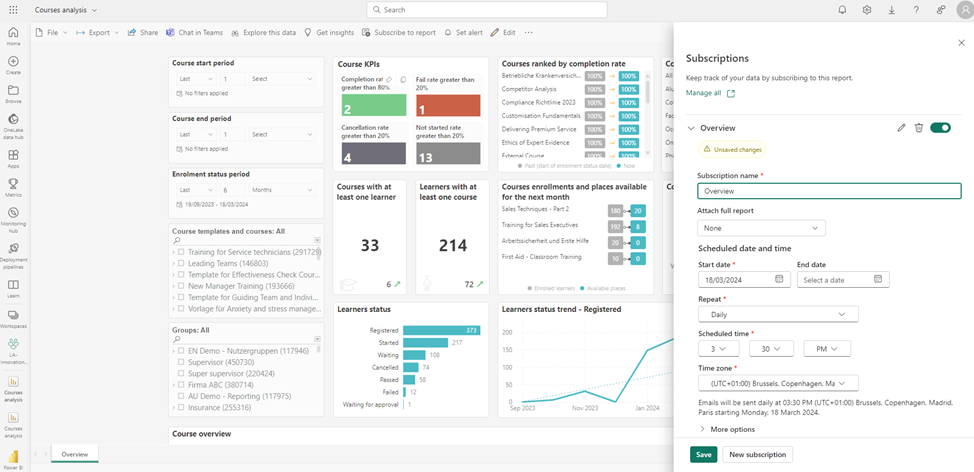
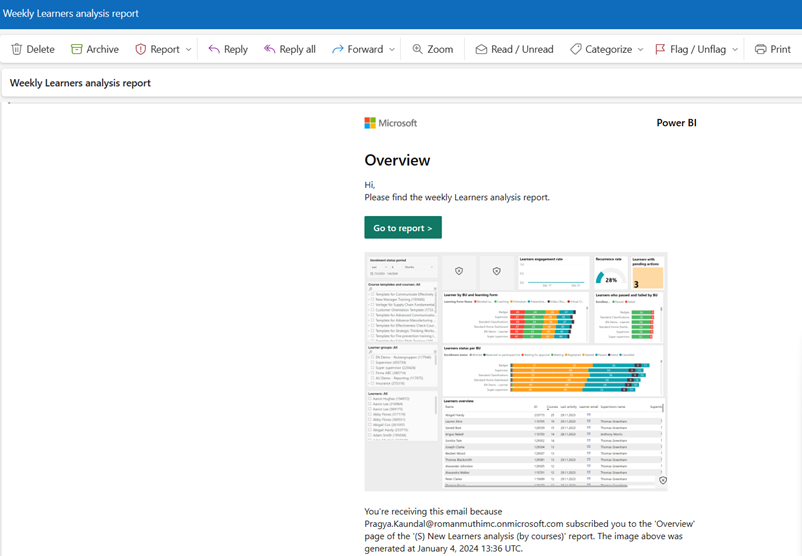
Eine E-Mail mit einer Momentaufnahme und einem Link zum Report oder Portal oder einem vollständigen Anhang des Reports (PDF oder PPT) oder Portal wird nach einer im Power BI-Dienst festgelegten Zeitplanung versendet.
Wenn der Empfänger über ein Microsoft Power BI Pro- oder Premium-Konto verfügt, kann er sich beim Power BI-Dienst anmelden und den Report/das Portal anzeigen. Andernfalls kann nur eine Momentaufnahme des Reports oder des Portals angezeigt werden.

Die Konfiguration „Weitere Optionen“ ermöglicht das Controlling der Zugriffsrechte der Abonnenten auf den Report. Dazu gehört die Erteilung der Berechtigung, den Report direkt in Power BI Service anzuzeigen, auf einen Link zum Report zuzugreifen oder eine Vorschau der Berichtsseite anzuzeigen.
Mit dem Abonnement kann der Abonnent die Leistungskennzahlen nach Bedarf zur Bewertung einsehen. Wenn Maßnahmen notwendig sind, kann der bereitgestellte Link angeklickt und der Report im Power BI Service geöffnet werden. Dort kann man weiter navigieren, um die Ursachenanalyse durchzuführen und entsprechend die notwendigen und relevanten Maßnahmen zu ergreifen.
Zu beachten ist, dass nur die Standardvisualisierungen von Microsoft Power BI Abonnements unterstützen und benutzerdefinierte Visualisierungen nicht im PDF- oder Microsoft Power Point-Format angezeigt werden können. Um sie im Power BI-Dienst anzuzeigen, ist ein Power BI-Konto notwendig.
Nicht unterstützte Funktionen
-
Bearbeiten des semantischen Modells von imc Learning Analytics in Power BI Service/Power BI Desktop
-
Lesezeichen-Fenster in imc Learning Analytics
-
Hinzufügen/Ändern der Row-Level-Sicherheit in Power BI-Reports, die mit dem semantischen Modell von imc Learning Analytics verbunden sind
-
Abonnement für andere durch einen externen B2B-Nutzer