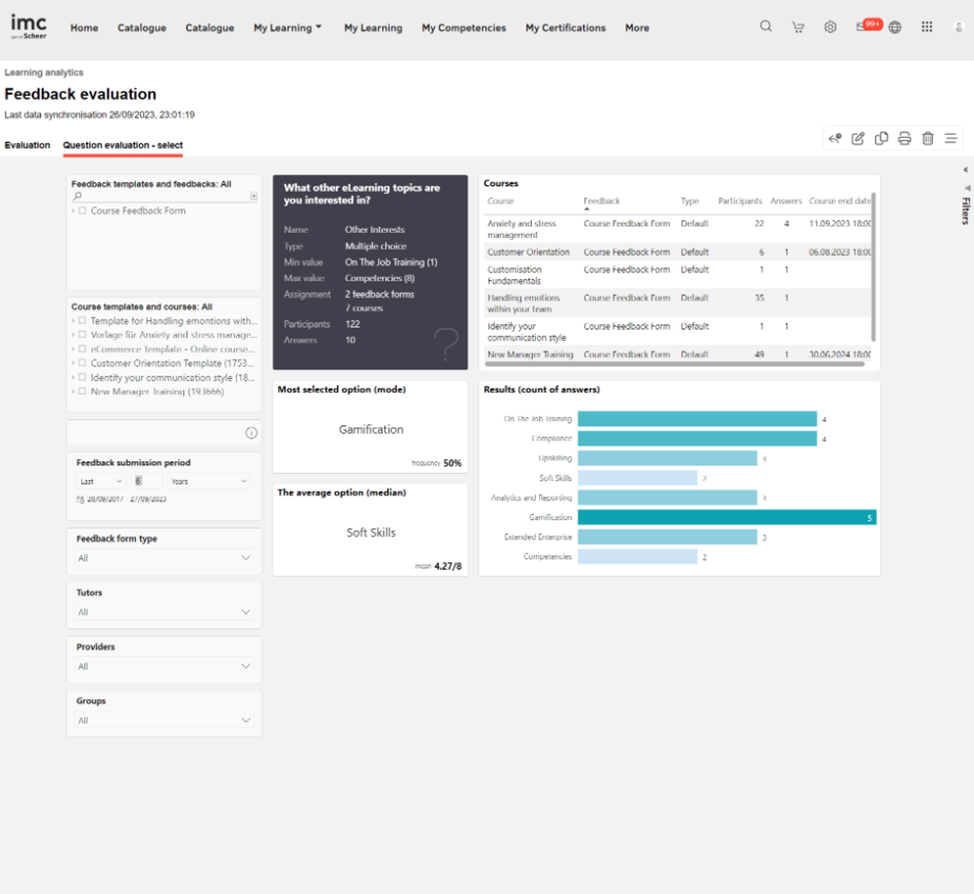
Dieser Report liefert dem Reportersteller eine detaillierte Bewertung der Rückmeldungen, sodass er die Leistung der Kurse bewerten und entsprechende Maßnahmen zur Steigerung der Kurseffizienz und der Zufriedenheit der Lerner ergreifen kann.
Leistungskennzahlen
Der Feedback-Evaluations-Report analysiert die folgenden KPIs in der angegebenen Reihenfolge.
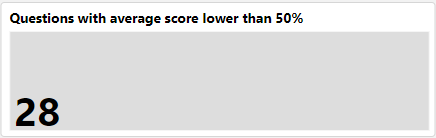
Dieses KPI zeigt die Anzahl der Fragen mit einer Durchschnittspunktzahl unter 50 % an, was darauf hinweist, dass die Kurse bei den Teilnehmern nicht gut angekommen sind und weiter verbessert werden müssen. Der Schwellenwert ist konfigurierbar. Die Durchschnittspunktzahl wird wie folgt berechnet:
Ja/Nein – (Anzahl der Nutzer, die mit „Ja“ geantwortet haben / Gesamtzahl der Antworten) * 100
Einzelantwort – (Durchschnittswert der Antworten/höchster Wert) * 100
Multiple Choice – (Durchschnittswert der Antworten/höchster Wert) * 100
Freitext: Anzahl der Teilnehmer, die positiv geantwortet haben / Gesamtzahl der Antworten) * 100
Für die Fragetypen „Reihenfolge“ und „Matrix-Feedback“ ist die Durchschnittspunktzahl nicht zutreffend.
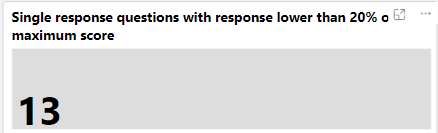
Dieses KPI zeigt die Anzahl der Fragen mit einer einzigen Antwort an, die mindestens eine Antwort erhalten haben, die unter oder gleich 20 % des Maximalwerts liegt, und hilft so, Ausreißer zu identifizieren.
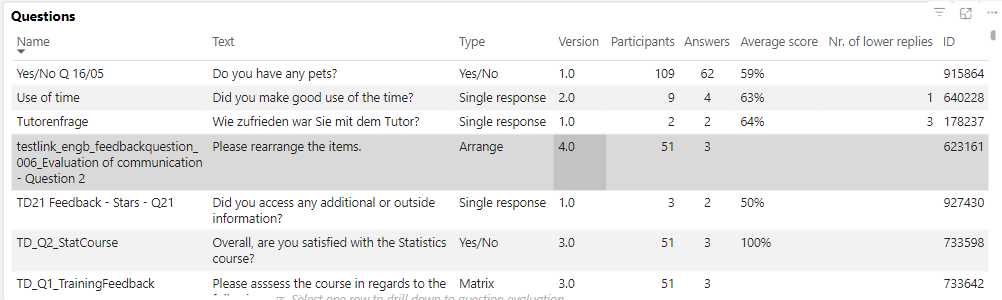
Diese Übersicht zeigt den Namen der Frage, den Text, den Typ, die veröffentlichte Version, die Anzahl der Teilnehmer der Kurse, denen die Feedback-Formulare zugeordnet sind, denen diese Fragen zugeordnet wurden (eingeschrieben, in Bearbeitung, bestanden, nicht bestanden, abgebrochen (nur wenn sie das Feedback abgegeben haben), die Anzahl der Antworten, die Durchschnittspunktzahl, die Anzahl der schlechteren Antworten und die Frage-ID.

Diese Kachel wird angezeigt, wenn die jeweilige Frage ausgewählt wird. Sie zeigt den Fragetext, den Namen, den Typ, den Mindestwert, den Höchstwert, die Anzahl der Feedback-Formulare, die Kurse, die Teilnehmer, denen diese Frage zugewiesen wurde, sowie die Anzahl der Antworten an.

Diese Übersicht zeigt die Kurse, denen die ausgewählte Feedbackfrage zugewiesen wurde, den Namen des Feedbackformulars, den Typ des Feedbackformulars, die Anzahl der Teilnehmer einschließlich der abgemeldeten Teilnehmer, sofern diese Antworten eingereicht haben, die Anzahl der Antworten und das Enddatum des Kurses.
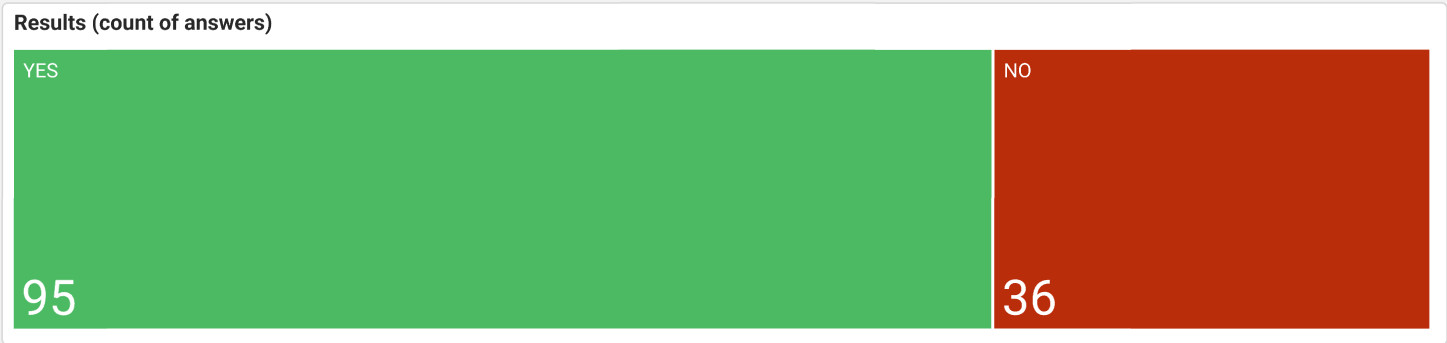
Dieses KPI zeigt an, wie viele Teilnehmer mit „Ja“ und wie viele mit „Nein“ geantwortet haben.

Dieses KPI zeigt an, wie viele Teilnehmer die jeweilige Option für die Single-Response-/Multiple-Choice-Frage gewählt haben (sowohl statistisch auswertbare als auch nicht auswertbare).
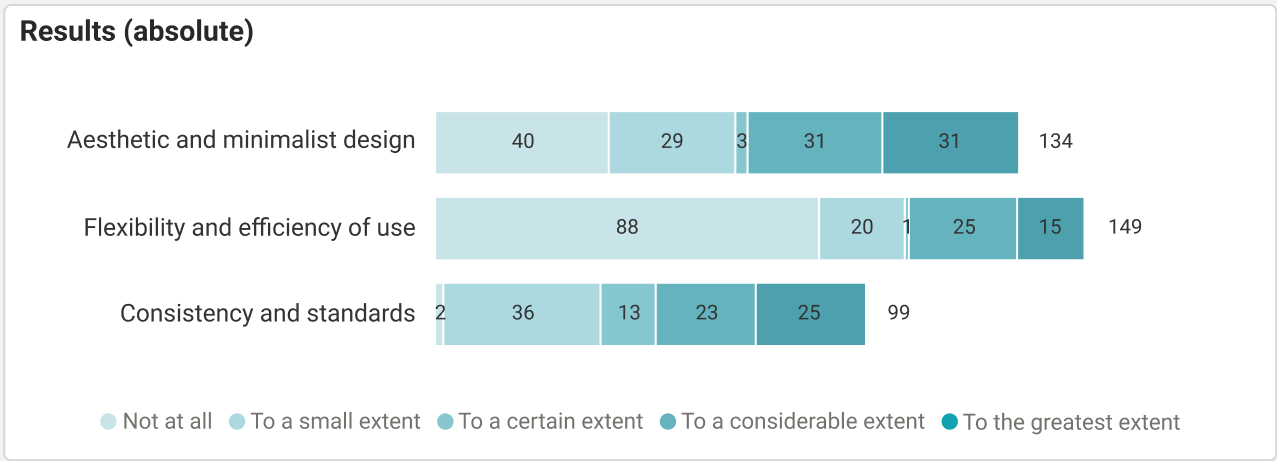
Dieses KPI zeigt die Anzahl der Teilnehmer an, die in jeder Zeile der ausgewählten Matrix-Feedback-Frage die jeweilige Option ausgewählt haben.
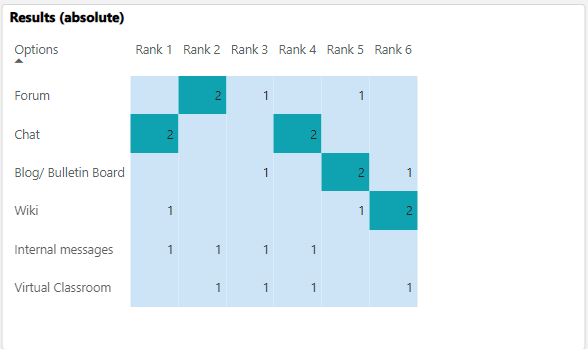
Dieses KPI listet die Anzahl der Teilnehmer auf, die den gewählten Punkt bei der gewählten Frage zum Feedback als ersten, zweiten usw. Rang bewertet haben.
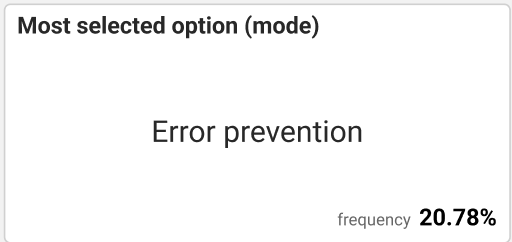
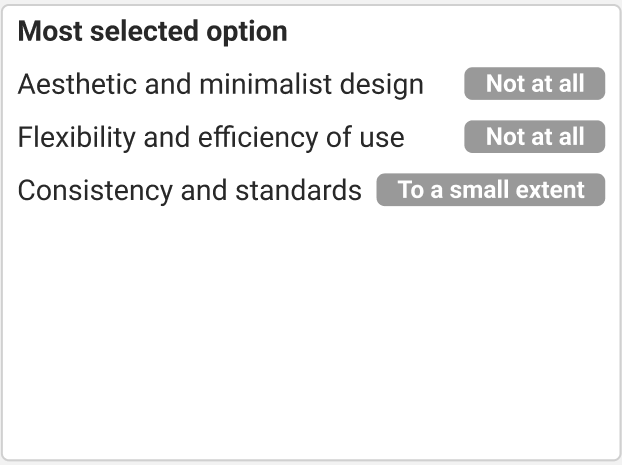
Dieses KPI zeigt an, welche Option von den meisten Teilnehmern für die gewählten Frage mit einer einzigen Antwort/Mehrfachauswahl/Anordnungsfeedbackformular ausgewählt wurde.

Dieses KPI zeigt die Option an, die von den meisten Teilnehmern für jede Zeile der gewählten Matrix-Feedback-Frage ausgewählt wurde.
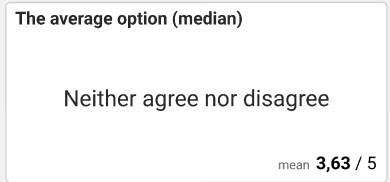
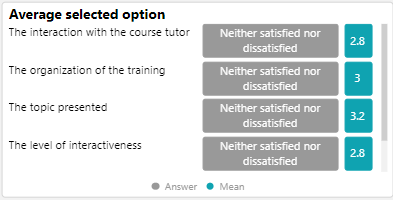
Dieses KPI zeigt die durchschnittliche Option für die gewählte Frage mit einer einzigen Antwort/Mehrfachauswahl im Feedback an. Bei nicht auswertbaren Fragen mit einer einzigen Antwort/Mehrfachauswahl im Feedback zeigt Dieses KPI „N/A“ an.
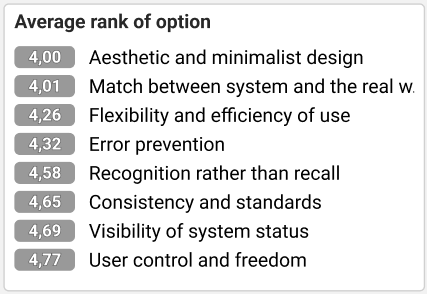
Dieses KPI zeigt den durchschnittlichen Rang jedes Artikels für die gewählte Frage zum Feedback zur Anordnung an.
Dieses KPI zeigt die durchschnittliche Option für jede Zeile der gewählten Matrix-Feedbackfrage an.
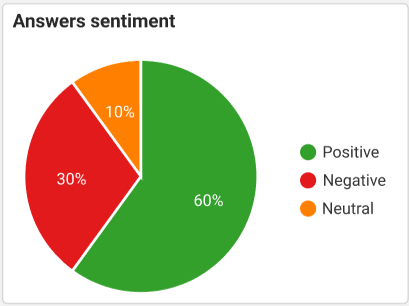
Dieses KPI zeigt den Prozentsatz der Teilnehmer an, die auf die gewählte Freitext-Feedbackfrage positiv, negativ oder neutral geantwortet haben.

Dieses KPI zeigt an, welche Wörter in den Antworten auf die gewählte Freitext-Feedbackfrage häufiger verwendet werden.
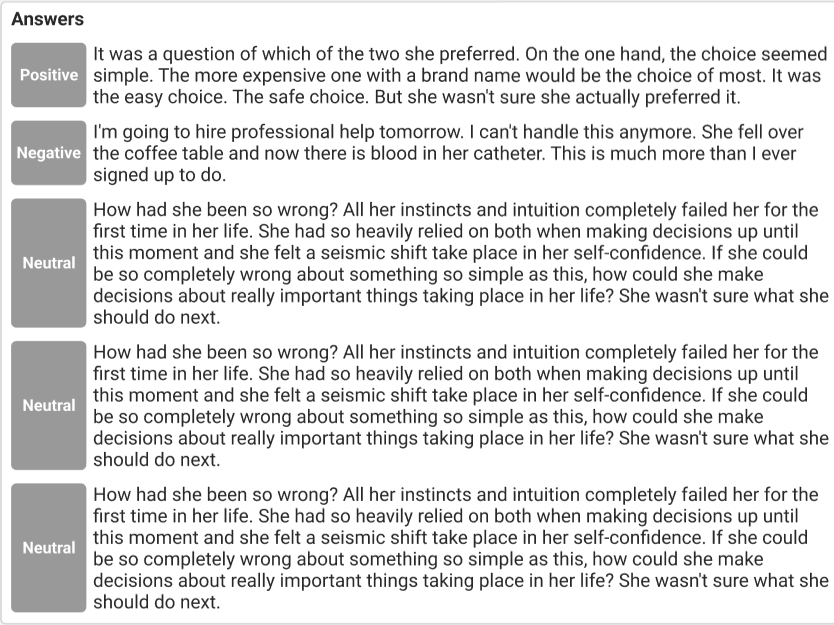
Dieses KPI zeigt eine Liste der Antworten jedes Teilnehmers auf die gewählte Freitext-Feedbackfrage an und gibt eine Benotung für jede Antwort an: positiv, negativ oder neutral.
Bitte beachten Sie Die KI-Funktionen wurden von Microsoft im September 2005 abgeschafft. Die von der Stimmungsanalyse abhängigen Grafiken zeigen vorerst keine Daten an.
Metriken
Der Feedback-Report zur Bewertung ermöglicht es, die Report-Ergebnisse nach den folgenden Metriken in der angegebenen Reihenfolge zu filtern.
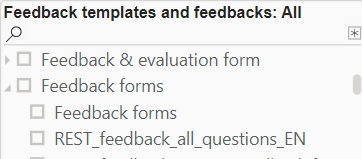
Diese Metrik listet alle Feedbackvorlagen und Feedbackformulare auf, die den Kursen zugewiesen sind, für die der Reportersteller Zugriffsrechte hat. Durch die Auswahl einer Feedbackvorlage werden auch alle aufgeführten Feedbackformulare dieser Vorlage ausgewählt.
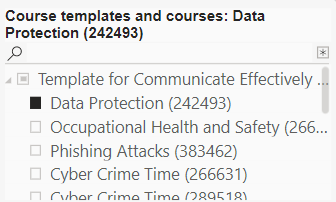
Diese Metrik listet die Kurse auf, auf die der Reportersteller Zugriffsrechte hat, sowie deren Kursvorlagen. Mit der Auswahl einer Kursvorlage werden auch alle aufgeführten Kurse dieser Vorlage ausgewählt.
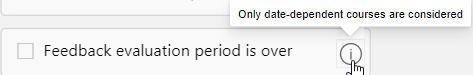
Wenn „Feedback-Bewertung ist abgelaufen“ ausgewählt ist, werden nur die Fragen aus den Feedback-Formularen berücksichtigt, die datumsabhängigen Kursen zugeordnet sind, für die die Feedback-Bewertung abgelaufen ist.
N/A wird angezeigt, wenn keine solche Feedback-Frage verfügbar ist.
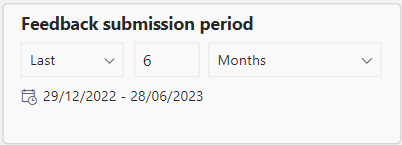
Diese Kennzahl filtert den Report nach dem gewünschten Zeitraum, in dem das Feedback eingereicht wurde. Der Standardzeitraum beträgt 6 Monate.
Diese Metrik filtert den Report nach dem gewünschten Feedbackformular-Typ (Standard, Transfer) der Feedbackvorlagen und Feedbackformulare, die den Kursen zugewiesen sind, auf die der Nutzer Zugriff hat, sowie nach deren Kursvorlagen.
Diese Metrik listet alle Tutoren auf, denen in der Kursvorlage und in den Kursen, auf die der Reportersteller Zugriffsrechte hat, die Tutorenrolle zugewiesen wurde.
Diese Metrik listet alle Veranstalter auf, die den Kursen zugewiesen sind, auf die der Reportersteller Zugriffsrechte hat.
Diese Metrik listet die Gruppen der Lernenden auf, die in den Kursen, auf die der Reportersteller Zugriff hat, gebucht sind, Fortschritte machen, nicht bestanden haben, bestanden haben oder abgebrochen haben (nur wenn sie Feedback abgegeben haben). Durch die Auswahl eines Gruppenbaumelements werden auch die Untergruppen ausgewählt.