Der Report „Lerneranalyse (nach Lernpfaden)“, der eine Bewertung der Interaktion der Lernenden mit den Lernpfaden und der Lernenden mit sofortiger Aufmerksamkeit enthält.
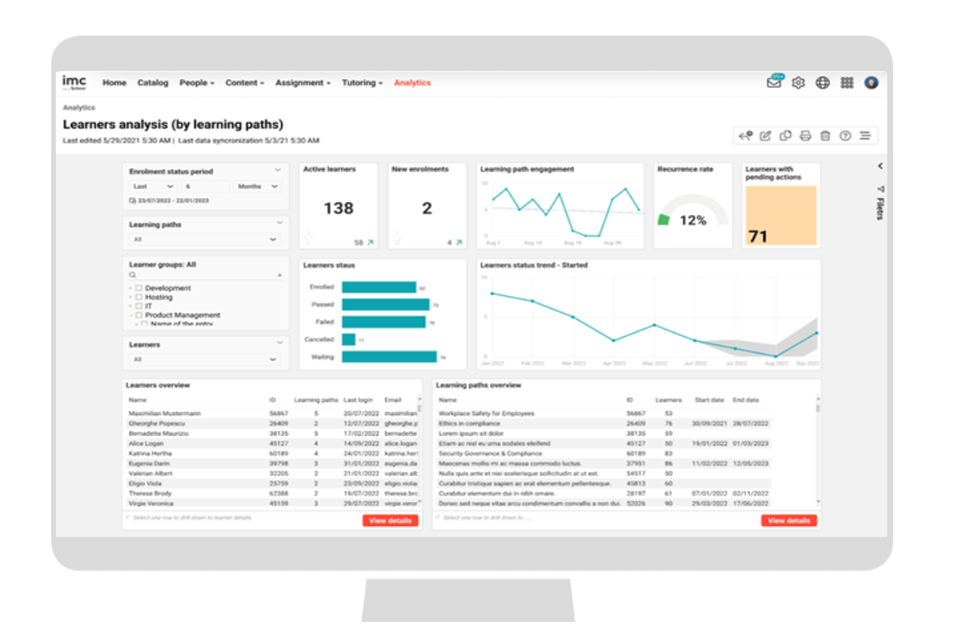
Leistungskennzahlen
Die folgenden KPIs sind im Report „Lerner-Analyse (nach Lernpfaden)“ in der angegebenen Reihenfolge aufgeführt.
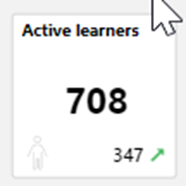
Die Anzahl der einzelnen Lernenden, die mindestens einen Kurs in den Lernpfaden aufgerufen haben, damit der Reportersteller einen Überblick über das Ausmaß der Training-Aktivitäten erhält, wird in diesem KPI angezeigt.
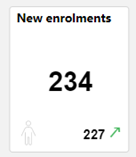
Dieses KPI zeigt, wie viele einzelne Lernende sich für die Lernpfade registriert haben, sodass der Reportersteller einen Überblick über das Ausmaß der Fortbildungsmaßnahmen erhält.

Die Beteiligung der Lernenden an den Lernpfaden im letzten Monat, damit der LA-Nutzer weiß, wie stark sich die Lernenden mit dem Lernpfad beschäftigen, wird in diesem KPI angezeigt. Die Beteiligung bezieht sich auf die Anzahl der Zugriffe der Lernenden auf den Lehrplan der Kurse der Lernpfade. Mehrere Zugriffe auf denselben Kurs innerhalb desselben Tages zählen nur als ein Zugriff.
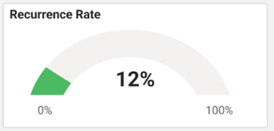
Der Prozentsatz der Lernenden, die aktiv lernen und auch im gleichen Zeitraum zuvor aktiv waren, wird in diesem KPI angezeigt.
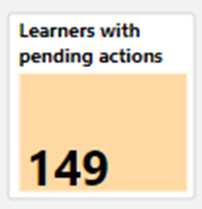
Dieses KPI zeigt alle Lernenden an, die den Status „Wartend“, „Wartend auf Genehmigung“ und „Auf der Warteliste reserviert“ auf dem Lernpfad haben.
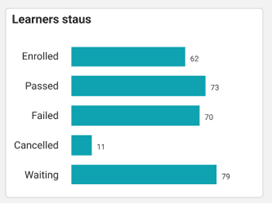
Dieses KPI zeigt die Anzahl der Lernenden mit dem jeweiligen Status auf den Lernpfaden.
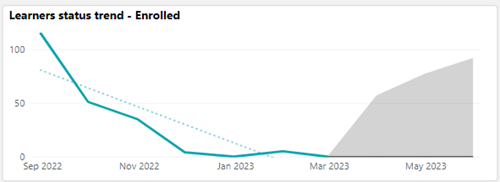
Dieses KPI zeigt die Anzahl der Lernenden in dem vom Reportersteller im Diagramm „Status der Lernenden” ausgewählten Status. Der Zeitraum wird durch die Metrik „Zeitraum des Buchung” definiert.
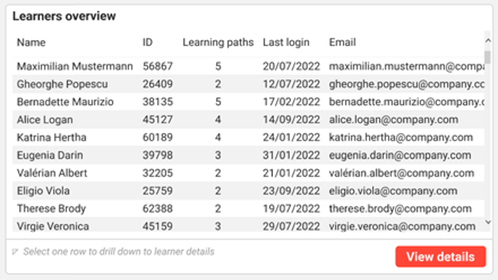
Die Lerner-Übersicht listet alle Lernenden mit der Nummer der ihnen zugewiesenen Lernpfade, dem letzten Login sowie ihrer E-Mail-Adresse auf.
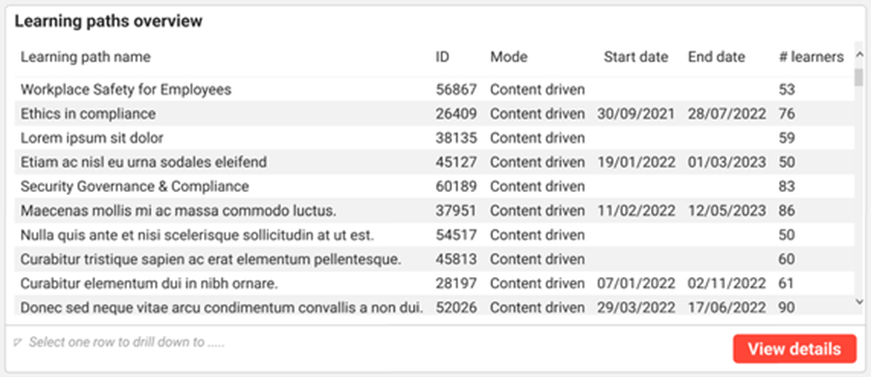
Diese „Übersicht über Lernpfade“ zeigt den Namen des Lernpfads, die Lernpfad-ID, die Anzahl der Lernenden sowie das Startdatum und das Enddatum an.
Metriken
Die folgenden Kennzahlen sind im Report zu den Lernpfaden in der angegebenen Reihenfolge aufgeführt.

Diese Kennzahl filtert den Report nach dem gewünschten Zeitraum, für den der Reportersteller an Änderungen des Buchungsstatus interessiert ist. Die Standardeinstellung sind die letzten sechs Monate.

Diese Kennzahl listet alle Lernpfade auf, an denen die Lerner teilnehmen, die in dem Report bewertet werden.
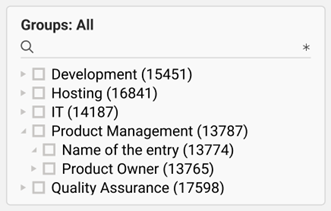
Diese Metrik listet alle Gruppen auf, für die der Reportersteller mindestens Leserechte hat. Durch Auswahl eines Elements aus dem Gruppenbaum werden auch die Untergruppen ausgewählt.
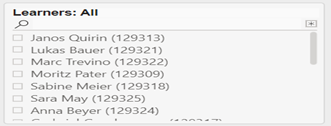
Diese Metrik listet alle Lernenden auf, für die der Reportersteller Zugriffsrechte hat und die ein persönliches Fälligkeitsdatum für die Lernpfade haben.