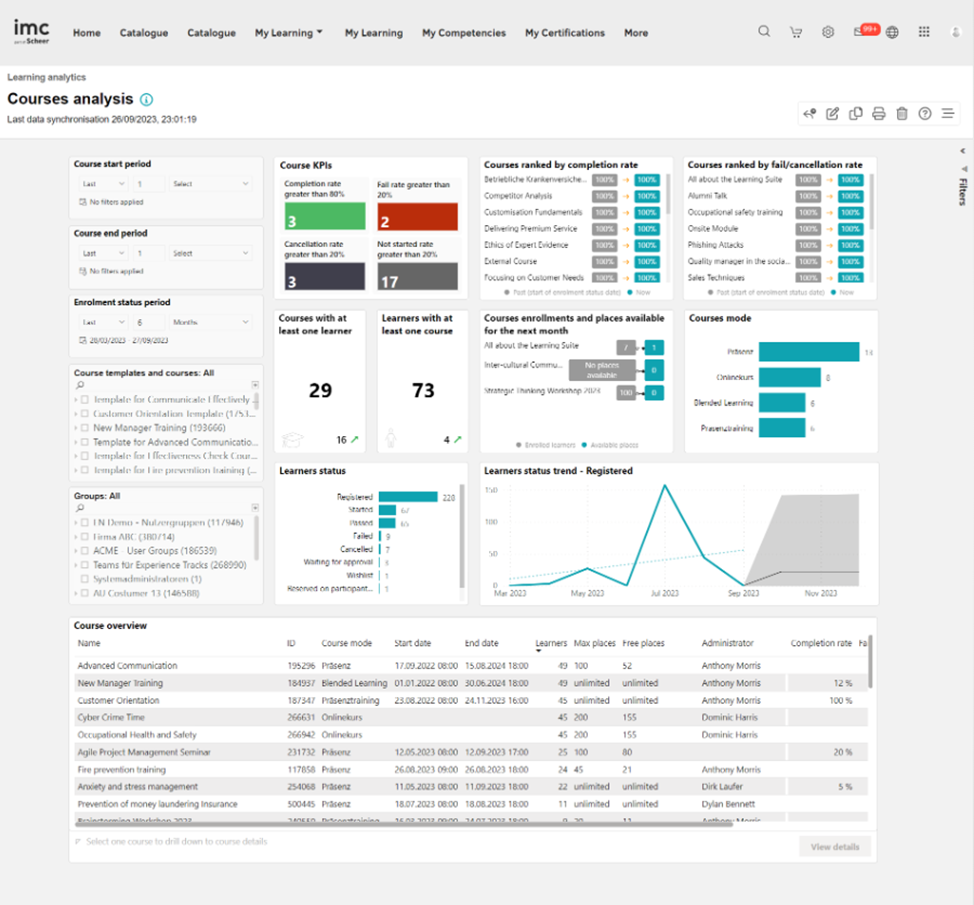
Der „Kursanalyse-Report“ bewertet, wie die Kurse laufen und welche sofortige Aufmerksamkeit erfordern.
Leistungskennzahlen
Der Kurs-Report analysiert die folgenden KPIs in der angegebenen Reihenfolge.
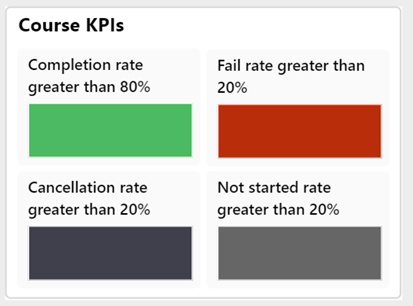
Durchfallquote größer als 20 %.
Dieses KPI zeigt, welche Kurse aufgrund einer hohen Durchfallquote besondere Aufmerksamkeit erfordern.
Nicht gestartet Rate größer als 20 %.
Dieses KPI zeigt, welche Kurse noch ausstehend sind, obwohl die Lerner bereits mit dem Lernen hätten beginnen sollen, sodass der Berichterstatter die erforderlichen Maßnahmen ergreifen kann, um die Lerner zum Start zu motivieren.
Stornierungsrate von mehr als 20 %.
Dieses KPI zeigt, welche Kurse aufgrund einer hohen Stornierungsrate verbessert werden müssen.
Abschlussquote von mehr als 80 %.
Dieses KPI zeigt, welche Best-Practice-Kurse aufgrund ihrer überragenden Leistung besonders empfehlenswert sind.
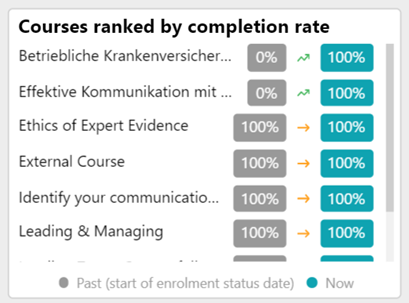
Dieses KPI listet die fünf besten Kurse in absteigender Reihenfolge ihrer Abschlussquote auf. Dieses KPI zeigt auch, wie sich die Abschlussquote seit Beginn des vom Berichterstatter gewählten „Buchungsstatuszeitraums” verändert hat. Der Pfeil zeigt den „Trend” an, je nachdem, ob der aktuelle Status höher oder niedriger ist als der Status zu Beginn des gefilterten „Buchungsstatuszeitraums”.
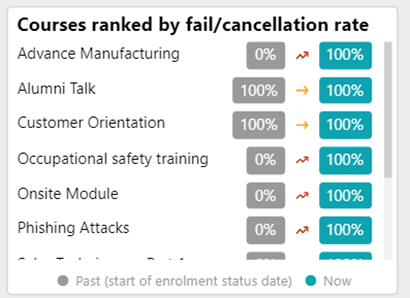
Dieses KPI listet die fünf besten Kurse in absteigender Reihenfolge ihrer Flop-Rate auf, die sich aus der Summe der Kurse, die nicht bestanden haben, und der Kurse, die abgesagt wurden, ergibt. Dieses KPI zeigt auch, wie sich die Flop-Rate seit Beginn des vom Berichterstatter gewählten „Buchungszeitraums” verändert hat.
Der Pfeil zeigt „den Trend“ an, je nachdem, ob der aktuelle Status höher oder niedriger ist als der Status zu Beginn des gefilterten „Statuszeitraums für Buchungen“.
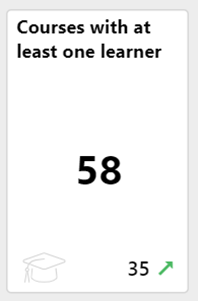
Dieses KPI zeigt die Anzahl der Kurse mit mindestens einem Lernenden, der gebucht ist, den Kurs in Bearbeitung hat, abgeschlossen hat, bestanden hat, nicht bestanden hat oder abgebrochen hat.
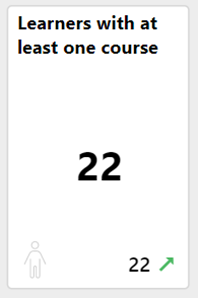
Dieses KPI zeigt die Anzahl der Lernenden mit Status (gebucht, in Bearbeitung, abgeschlossen, bestanden, nicht bestanden oder abgesagt) in mindestens einem Kurs. Er zeigt auch, wie viele Lernende seit Beginn des Buchungszeitraums für die Kurse hinzugekommen sind bzw. weggefallen sind.
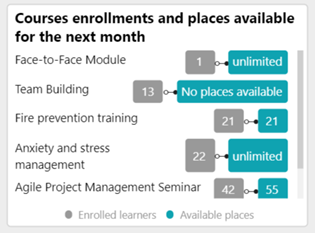
Die terminabhängigen Kurse, die im nächsten Monat beginnen und noch Plätze frei haben.
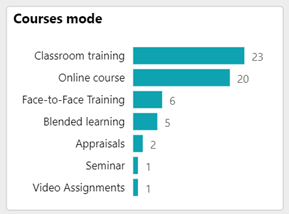
Die Anzahl der Lerner für jede Lernform der Kurse (Online-Kurs, Präsenz-Training usw.) ist in diesem KPI ersichtlich.
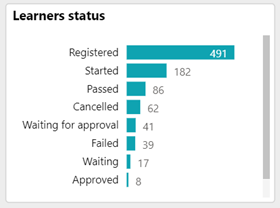
Die Anzahl der Lernenden mit dem jeweiligen Status für die Kurse, die der Berichterstatter verwaltet, wird in diesem KPI angezeigt.
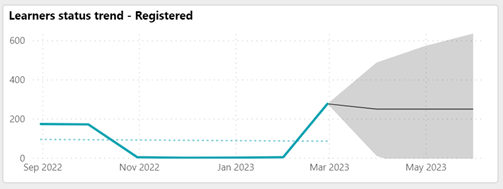
Die Anzahl der Nutzer, deren Status vom Berichtersteller im visuellen „Lernstatus-Trend“ ausgewählt wurde, wird in diesem KPI angezeigt. Der zu berücksichtigende Zeitraum wird durch die Metrik „Zeitraum der Buchung“ definiert.
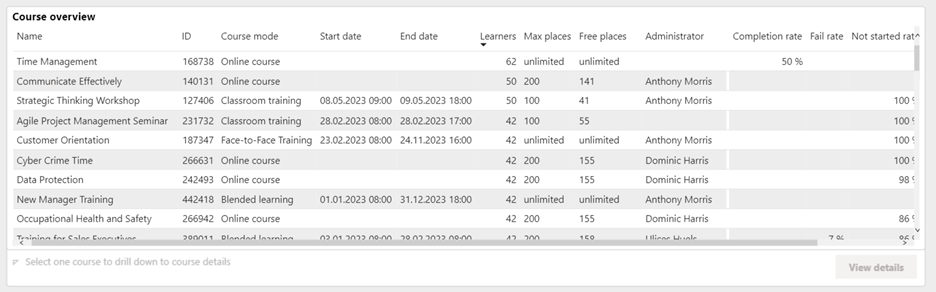
Diese „Kursübersicht“ zeigt den Kursnamen, die Komponenten-ID, die Lernform, das Startdatum, das Enddatum, die Anzahl der Lernenden, die maximale Teilnehmerzahl, die Anzahl der freien Plätze, den vollständigen Namen des Administrators, die E-Mail-Adresse des Administrators, die Abschlussquote, die Durchfallquote, die Nicht-Startquote und die Stornierungsquote.
Metriken
Die folgenden Kennzahlen sind im Kursanalyse-Report in der angegebenen Reihenfolge aufgeführt.

Diese Kennzahl filtert den Report nach Kursen, deren Startdatum in den ausgewählten Zeitraum fällt.
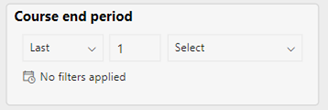
Diese Kennzahl filtert den Report nach Kursen, deren Enddatum in den ausgewählten Zeitraum fällt.
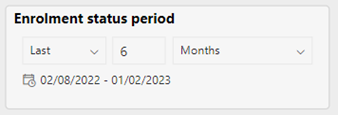
Diese Kennzahl filtert den Report nach dem gewünschten Zeitraum, für den der Reportersteller die Änderungen des Status der Lerner sehen möchte. Die Standardeinstellung sind die letzten sechs Monate.
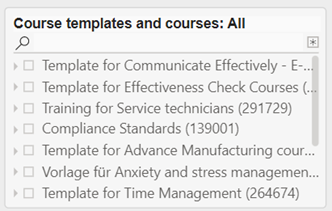
Diese Metrik listet die Kurse auf, auf die der Berichterstatter Zugriffsrechte hat, sowie deren Kursvorlagen. Mit der Auswahl einer Kursvorlage werden auch alle aufgeführten Kurse dieser Vorlage ausgewählt.
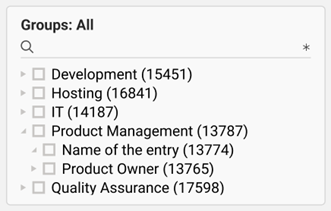
Diese Metrik listet alle Gruppen auf, die Lerner enthalten, die mit den Kursen in Verbindung stehen, auf die der Berichtersteller Zugriffsrechte hat. Durch die Auswahl eines Gruppenbaumelements werden auch die Untergruppen ausgewählt.