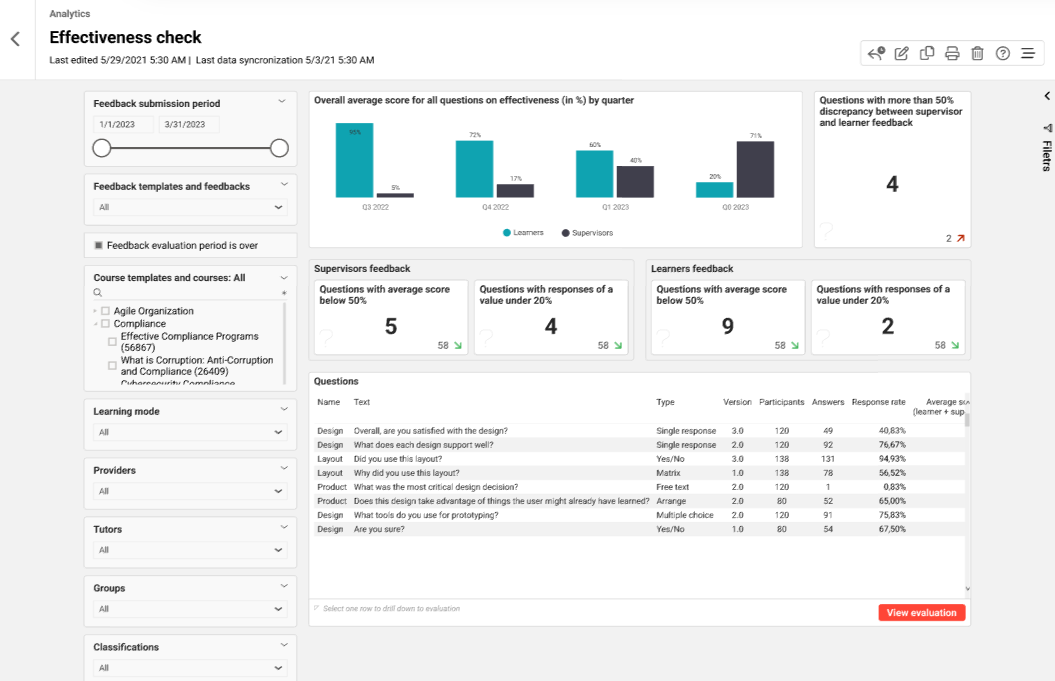
Dieser Bericht liefert dem Berichtsausführenden eine detaillierte Bewertung der Antworten auf das Feedback-Formular zur Wirksamskeitskontrolle, damit er die Wirksamkeit der durchgeführten Trainings bewerten kann.
Leistungskennzahlen
Der Report zur Wirksamskeitskontrolle analysiert die folgenden KPIs in der angegebenen Reihenfolge.
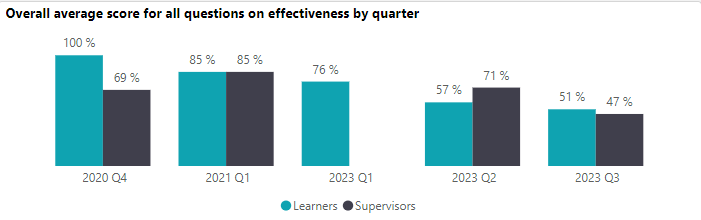
Dieser KPI zeigt die durchschnittliche Punktzahl für alle Fragen zur Effektivität (in Prozent) pro Quartal. Die durchschnittliche Punktzahl wird wie folgt berechnet:
Ja/Nein – (Anzahl der Nutzer, die mit „Ja“ geantwortet haben / Gesamtzahl der Antworten) * 100.
Einzelantwort – (Durchschnittswert der Antworten/höchster Wert) * 100
Multiple Choice – (Durchschnittswert der Antworten/höchster Wert) * 100
Freitext: Anzahl der Teilnehmer, die positiv geantwortet haben / Gesamtzahl der Antworten) * 100.
MatrixSumme der Durchschnittswerte jeder Zeile / Anzahl der Zeilen
Für den Fragetyp „Feedback“ ist die Durchschnittspunktzahl nicht verfügbar.

Dieser KPI zeigt die Anzahl der Fragen an, bei denen die Rückmeldungen von Vorgesetzten und Lernern um mehr als 50 % voneinander abweichen.
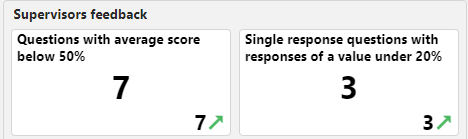
Dieser KPI zeigt die Anzahl der Fragen mit einer Durchschnittspunktzahl unter 50 % an, was darauf hinweist, dass die Kurse bei den Teilnehmern nicht gut angekommen sind und weiter verbessert werden müssen.
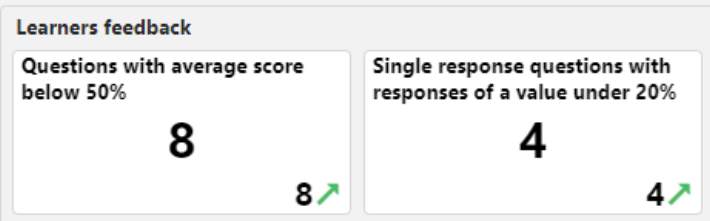
Außerdem zeigt der KPI die Anzahl der Fragen mit nur einer Antwort an, die weniger als oder gleich 20 % des Maximalwerts erreicht haben, und hilft so, Ausreißer zu identifizieren.
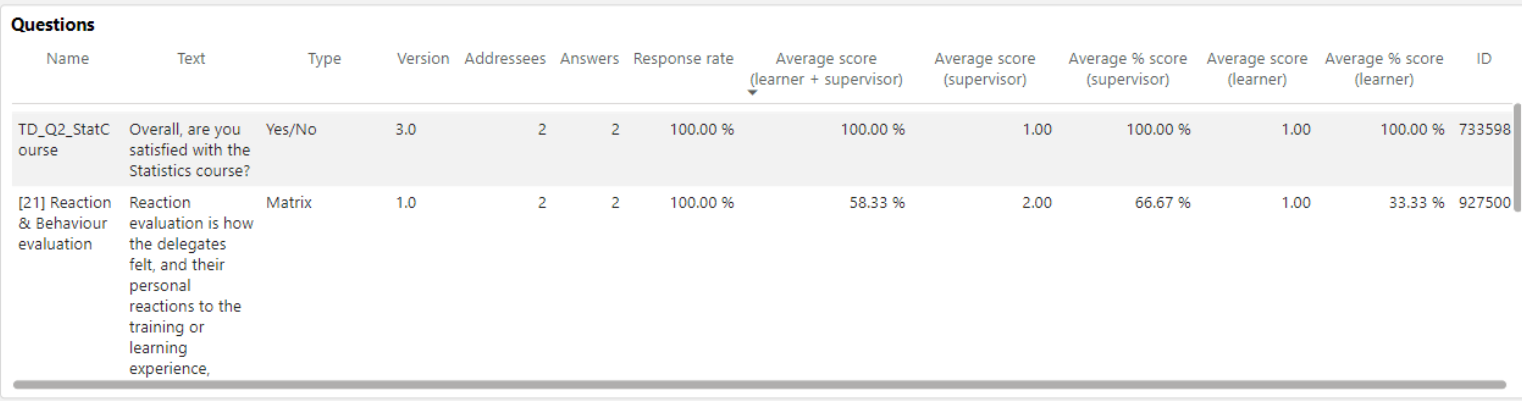
Diese Übersicht zeigt den Namen der Frage, den Text, den Typ, die veröffentlichte Version, die Anzahl der Adressaten (Teilnehmer (angemeldet, in Bearbeitung, bestanden, nicht bestanden, abgebrochen, wenn eine Antwort eingereicht wurde) und deren Vorgesetzte), die Anzahl der Antworten, die Antwortquote, den durchschnittlichen Antwortwert in % (Lerner und Vorgesetzte zusammen), den durchschnittlichen Antwortwert (Vorgesetzte), den durchschnittlichen Antwortwert in % (Vorgesetzte) und den durchschnittlichen Antwortwert (Lerner).
Durchschnittlicher Antwortwert in % (Lerner) und Fragen-ID.
Bitte beachten Sie Die KI-Funktionen wurden von Microsoft im September 2005 abgeschafft.Die „Durchschnittspunktzahl“ für Freitextfragen würde vorerst 0 % betragen.
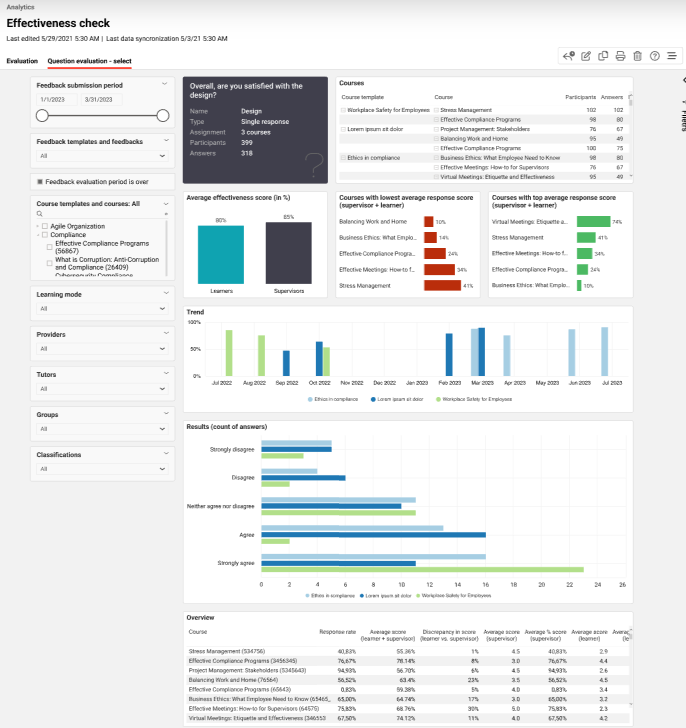
Drilldown-Seite
Die Drilldown-Seite analysiert die folgenden KPIs in der angegebenen Reihenfolge.
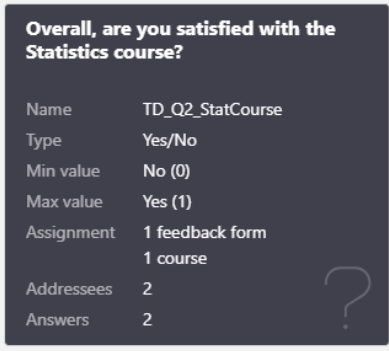
Diese Karte wird angezeigt, wenn die jeweilige Frage nominiert wurde. Sie zeigt den Fragetext, den Namen, den Typ, den Mindestwert, den Höchstwert, die Anzahl der Feedback-Formulare, die Kurse, die Adressen, an die diese Frage zugewiesen wurde, sowie die Anzahl der Antworten an.
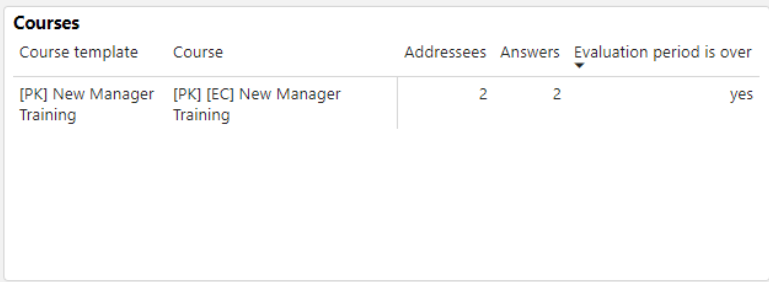
Diese Übersicht zeigt Kursvorlagen und Kurse, denen die nominierte Feedbackfrage zugewiesen wurde, Adressen, Anzahl der Antworten und ob der Zeitraum für die Feedback-Bewertung abgelaufen ist.

Dieser KPI zeigt die durchschnittliche Effektivitätsbewertung (in %) an, die von den Lernern und Vorgesetzten für die nominierte Feedback-Frage vergeben wurde.
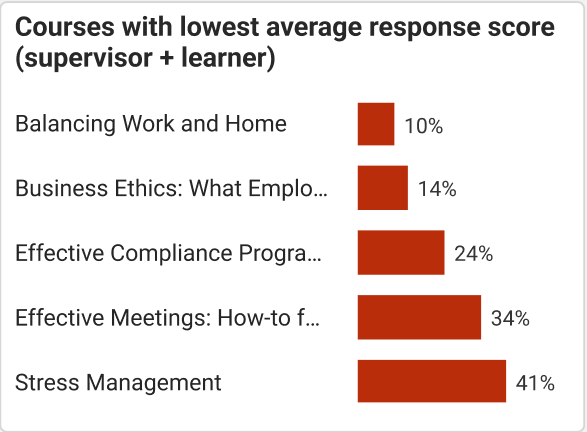
Dieser KPI zeigt die Kurse mit der niedrigsten Durchschnittsbewertung (in %) an, die von den Lernern und Vorgesetzten für die nominierte Feedbackfrage vergeben wurde.
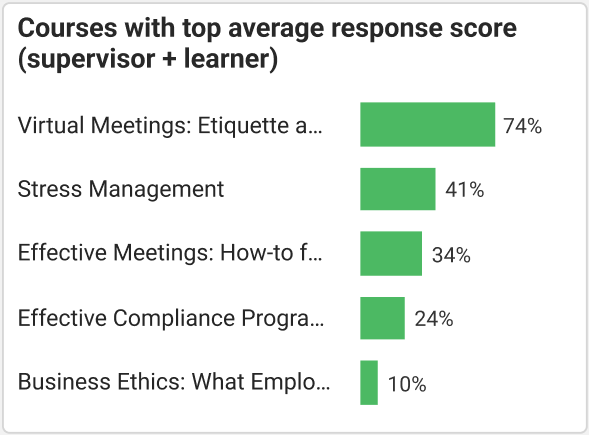
Dieser KPI zeigt die Kurse mit der höchsten Durchschnittsbewertung (in %) an, die von den Lernern und Vorgesetzten für die nominierte Feedback-Frage vergeben wurde.
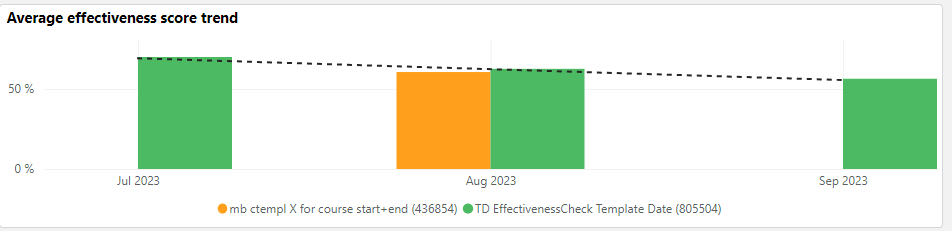
Dieser KPI zeigt den Trend der kombinierten Durchschnittsbewertung (in %) durch den Lerner und den Vorgesetzten im Vergleich der Kursvorlagen (einschließlich Versionen) für die nominierte Frage an.
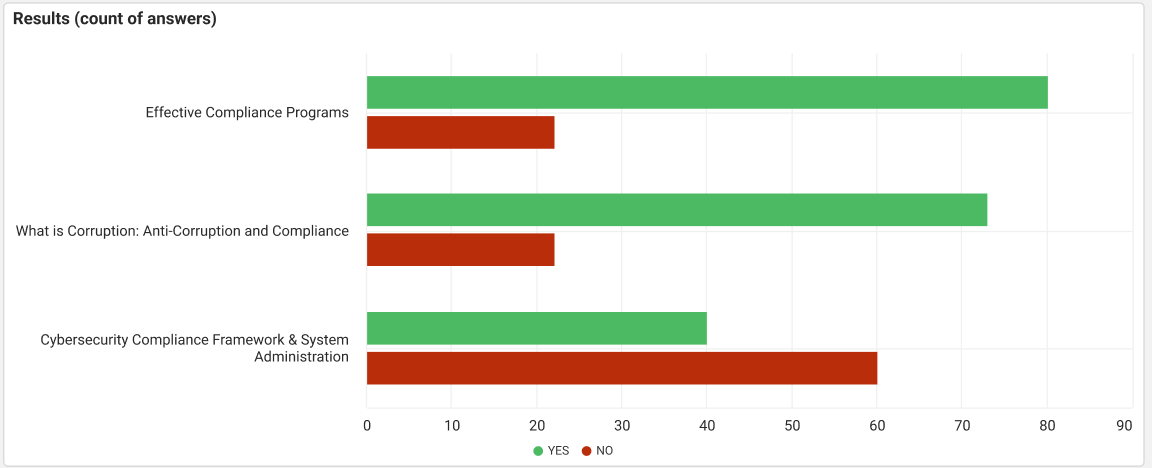
Dieser KPI zeigt an, wie viele Teilnehmer bei der nominierten Ja/Nein-Feedbackfrage mit „Ja“ und wie viele mit „Nein“ geantwortet haben, und vergleicht dies kursübergreifend.
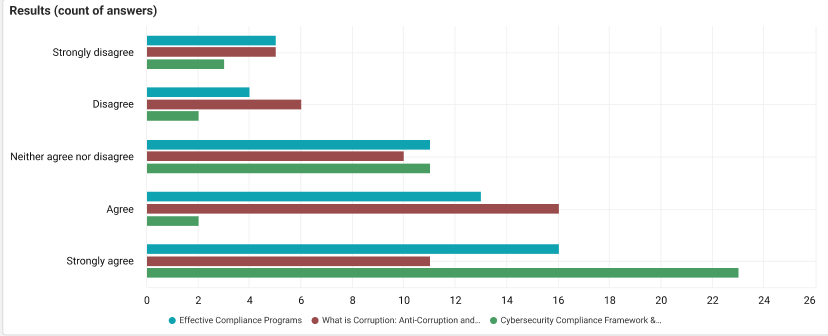
Dieser KPI zeigt an, wie viele Teilnehmer die jeweilige Option für eine Feedbackfrage mit einer einzigen Antwort/Mehrfachauswahl gewählt haben, und vergleicht dies kursübergreifend.
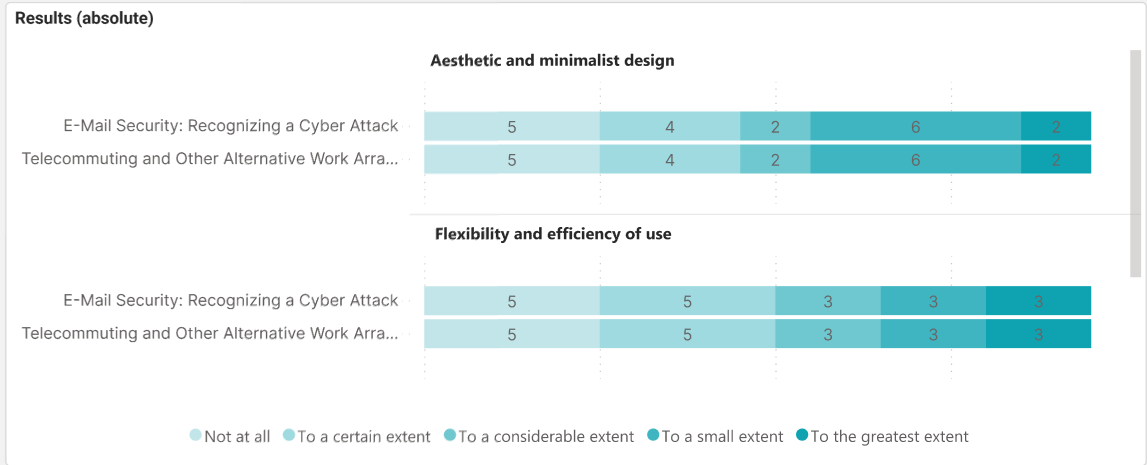
Dieser KPI zeigt die Anzahl der Teilnehmer an, die die jeweilige Option in jeder Zeile der nominierten Matrix-Feedbackfrage ausgewählt haben, und vergleicht diese über die Kurse hinweg.
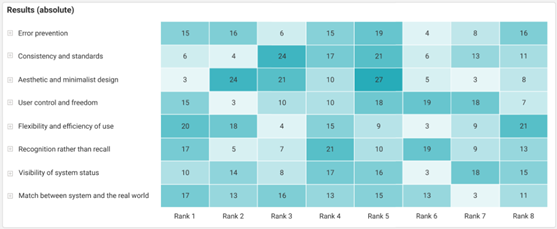
Dieser KPI zeigt die Anzahl der Teilnehmer an, die den bestimmten Punkt bei der nominierten Frage zum Feedback zur Kursgestaltung an erster, zweiter usw. Stelle bewertet haben, und vergleicht diese über die Kurse hinweg.

Dieser KPI zeigt die Option mit dem höchsten Durchschnittsrang für die nominierte Ordnungsfrage an und vergleicht sie über die Kurse hinweg.

Dieser KPI zeigt Antworten auf die nominierte Freitext-Feedbackfrage an, gibt für sie eine Benotung von positiv über negativ bis zu neutral an und vergleicht sie kursübergreifend.
Bitte beachten Sie Die KI-Funktionen wurden von Microsoft im September 2005 abgeschafft.Die auf der Stimmungsanalyse basierenden Grafiken würden vorerst keine Daten anzeigen.
Metriken
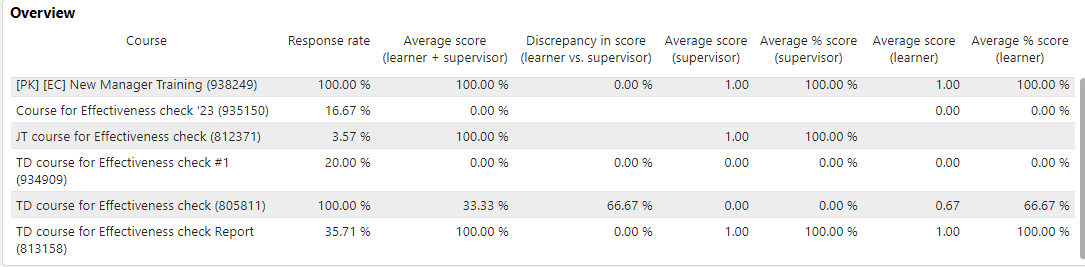
Diese Übersicht zeigt den Kursnamen, die Rücklaufquote, die durchschnittliche Punktzahl der Befragten, die Diskrepanz in der Punktzahl (Lerner vs. Vorgesetzter), die durchschnittliche Punktzahl (Vorgesetzter), die durchschnittliche Punktzahl in Prozent (Vorgesetzter), die durchschnittliche Punktzahl (Lerner), die durchschnittliche Punktzahl in Prozent (Lerner) und die Kurskarte an.
Metriken
Der Bericht zur Wirksamskeitskontrolle ermöglicht es, die Report-Ergebnisse nach den folgenden Metriken in der angegebenen Reihenfolge zu filtern.
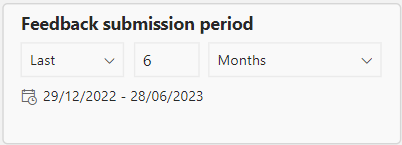
Diese Kennzahl filtert den Report nach dem gewünschten Zeitraum, in dem das Feedback eingereicht wurde. Der Standardzeitraum beträgt 6 Monate.
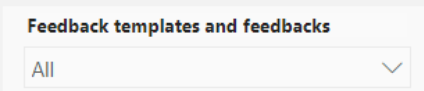
Diese Metrik listet alle Feedbackvorlagen und Feedbackformulare auf, die den Kursen zugewiesen sind, für die der Berichterstatter Zugriffsrechte hat. Durch die Auswahl einer Feedbackvorlage werden auch alle aufgeführten Feedbackformulare dieser Vorlage ausgewählt.

Wenn „Feedback-Auswertungszeitraum ist abgelaufen“ ausgewählt ist, werden nur die Fragen aus den Feedback-Formularen berücksichtigt, die datumsabhängigen Kursen zugeordnet sind, für die der Feedback-Auswertungszeitraum abgelaufen ist.
N/A wird angezeigt, wenn keine solche Feedback-Frage verfügbar ist.
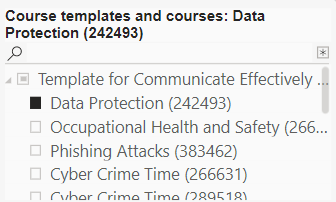
Diese Metrik listet alle Kurse auf, auf die der Berichterstatter Zugriff hat, sowie deren Kursvorlagen. Durch die Auswahl einer Kursvorlage werden auch alle aufgeführten Kurse dieser Vorlage ausgewählt.
Diese Metrik listet alle Lernformen auf, die den Kursen zugewiesen sind, auf die der Berichtersteller Zugriffsrechte hat.
Diese Metrik listet alle Veranstalter auf, die den Kursen zugewiesen sind, auf die der Berichterstatter Zugriffsrechte hat.
Diese Metrik listet alle Tutoren auf, denen in der Kursvorlage und in den Kursen, auf die der Berichtersteller Zugriffsrechte hat, die Tutorenrolle zugewiesen wurde.

Diese Metrik filtert den Report nach der gewünschten Klassifizierung, die der Feedbackfrage im Feedback-Formular zugewiesen wurde, die zur Wirksamskeitskontrolle der Kurse gehört, auf die der Nutzer Zugriff hat.