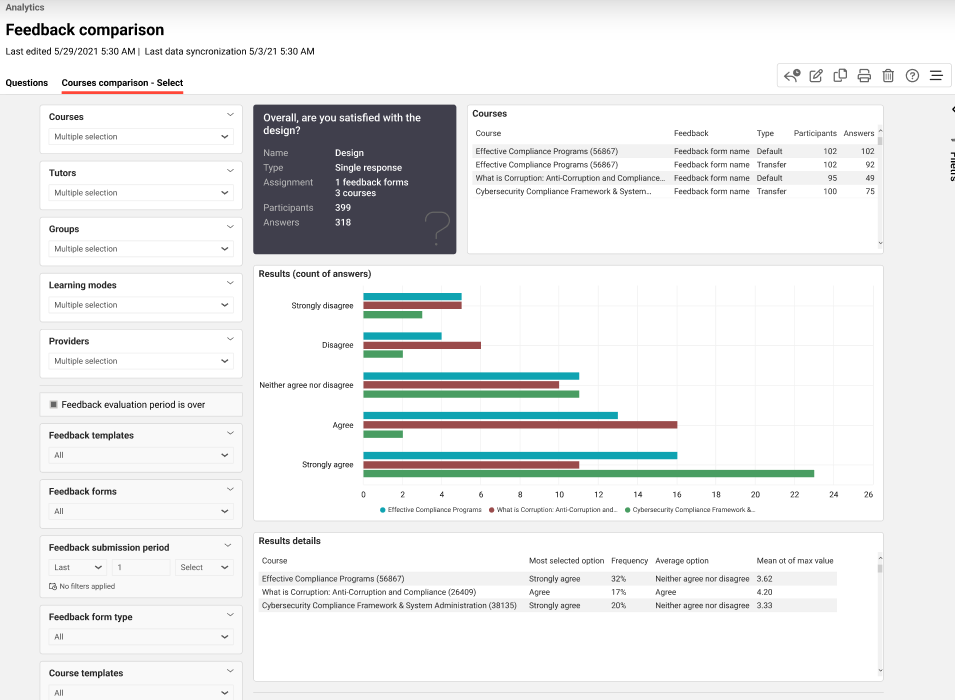
Dieser Report ermöglicht es dem Report-Ersteller, die Rückmeldungen in verschiedenen Dimensionen zu vergleichen, sodass er einen Drilldown durchführen kann, um die Gründe für die schlechten Leistungen einiger Kurse zu ermitteln.

Leistungskennzahlen
Der Report “Feedback-Vergleich” analysiert die folgenden KPIs in der angegebenen Reihenfolge.
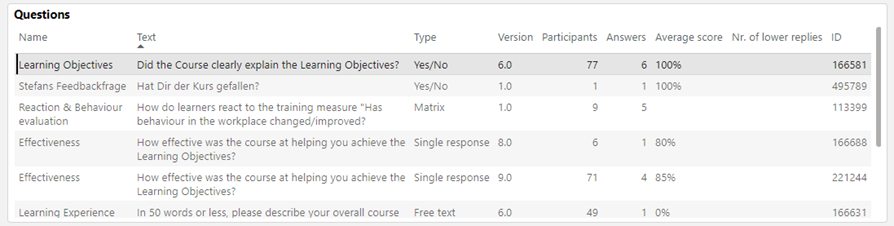
Diese Übersicht zeigt den Namen der Frage, den Text, den Typ, die veröffentlichte Version, die Anzahl der Teilnehmer der Kurse, denen die Feedback-Formulare zugeordnet sind, denen diese Fragen zugeordnet wurden (gebucht, in Bearbeitung, bestanden, nicht bestanden, abgebrochen (nur wenn sie das Feedback abgegeben haben), die Anzahl der Antworten, die Durchschnittspunktzahl, die Anzahl der niedrigeren Antworten und die Frage-ID.
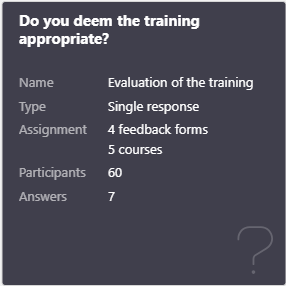
Diese Kachel wird angezeigt, wenn die jeweilige Frage ausgewählt wird. Sie zeigt den Fragetext, den Namen, den Typ, den Mindestwert, den Höchstwert, die Anzahl der Feedback-Formulare, die Kurse, die Teilnehmer, denen diese Frage zugewiesen wurde, sowie die Anzahl der Antworten an.
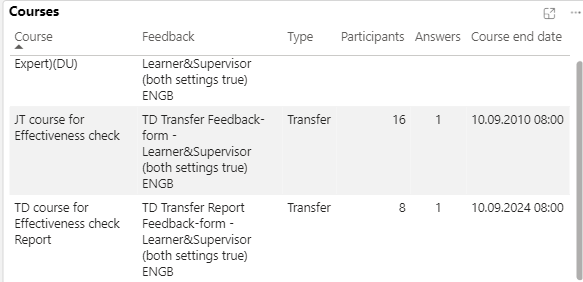
Diese Übersicht zeigt die Kurse, denen die ausgewählte Feedbackfrage zugewiesen wurde, den Namen des Feedbackformulars, den Typ des Feedbackformulars, die Anzahl der Teilnehmer einschließlich der abgemeldeten Teilnehmer, sofern diese Antworten eingereicht haben, die Anzahl der Antworten und das Enddatum des Kurses.
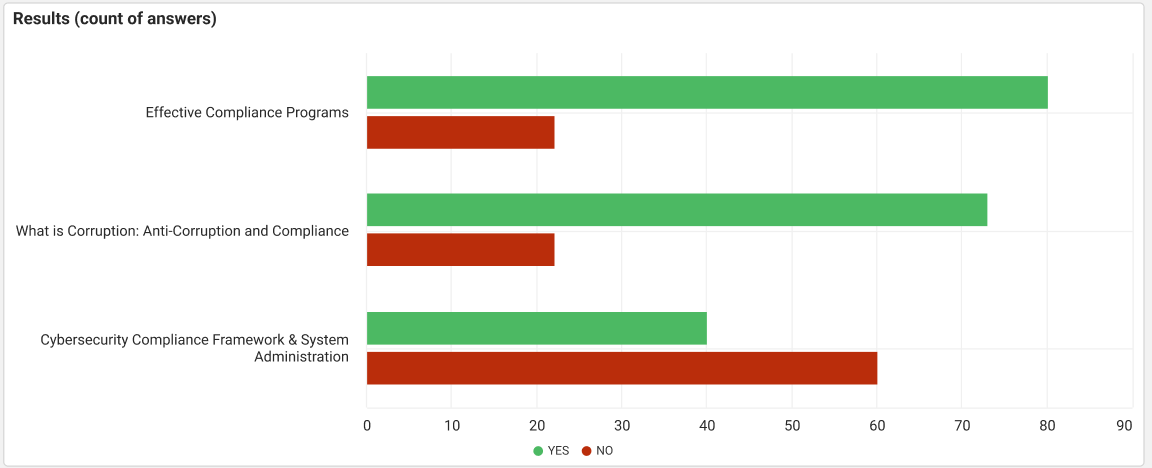
Dieses KPI zeigt an, wie viele Teilnehmer bei der ausgewählten Ja/Nein-Feedbackfrage mit „Ja“ und wie viele mit „Nein“ geantwortet haben, und vergleicht dies über die ausgewählte Dimension hinweg.
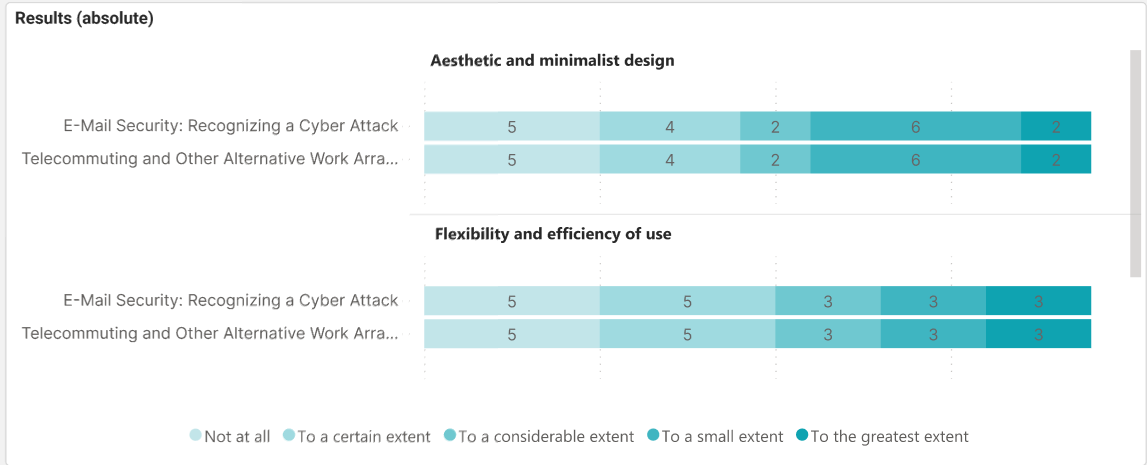
Dieses KPI zeigt die Anzahl der Teilnehmer an, die die jeweilige Option in jeder Zeile der ausgewählten Matrix-Feedbackfrage ausgewählt haben, und vergleicht diese über die gewählte Dimension hinweg.
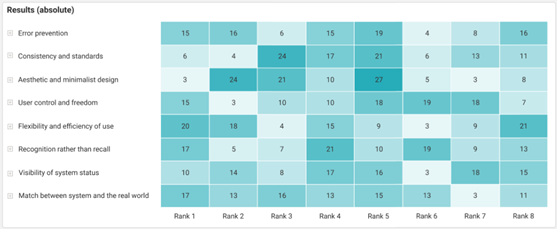
Dieses KPI zeigt die Anzahl der Teilnehmer an, die den bestimmten Punkt bei der ausgewählten Frage zum Feedback zur Anordnung auf Rang 1, Rang 2 usw. bewertet haben, und vergleicht diese über die ausgewählte Dimension hinweg.

Dieses KPI zeigt die am häufigsten ausgewählte Option für die ausgewählte Ja/Nein-Feedbackfrage an und vergleicht sie über die ausgewählte Dimension hinweg.
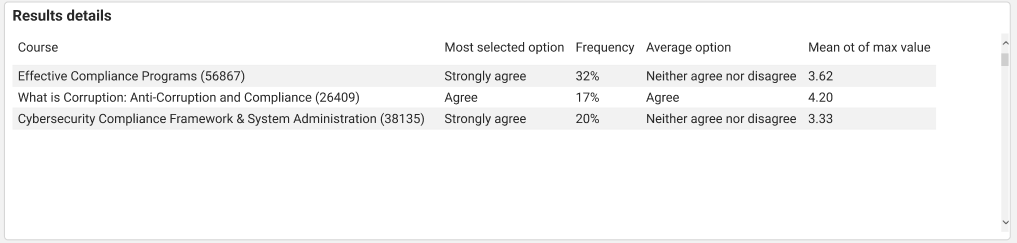
Dieses KPI zeigt die am häufigsten ausgewählte und die Option mit dem höchsten Durchschnittswert für die ausgewählte Frage mit einer einzigen Antwort/Multiple-Choice-Feedback an und vergleicht sie über die ausgewählte Dimension hinweg.

Dieses KPI zeigt die Option mit dem höchsten Durchschnittsrang für die ausgewählte Ordnungsfrage an und vergleicht sie über die ausgewählte Dimension hinweg.
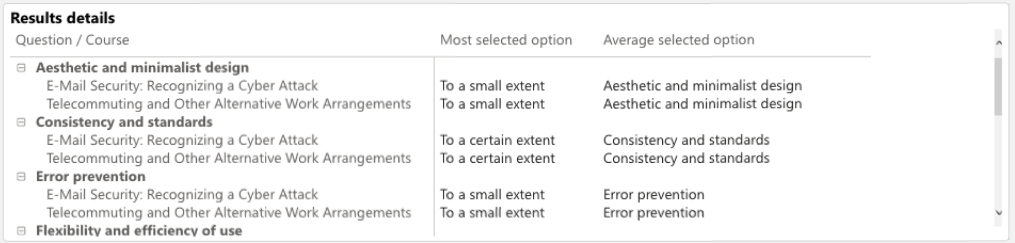
Dieses KPI zeigt die am häufigsten ausgewählte und die Option mit dem höchsten Durchschnittswert für die ausgewählte Matrix-Feedback-Frage an und vergleicht sie über die ausgewählte Dimension hinweg.
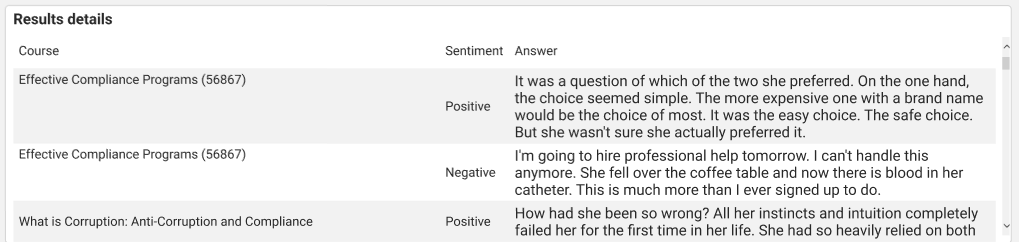
Dieses KPI zeigt Antworten auf die ausgewählte Freitext-Feedbackfrage an, gibt für sie eine Benotung von positiv über negativ bis zu neutral an und vergleicht sie über die ausgewählte Dimension hinweg.
Bitte beachten Sie Die KI-Funktionen wurden von Microsoft im September 2005 abgeschafft. Die von der Stimmungsanalyse abhängigen Grafiken zeigen vorerst keine Daten an.
Abmessungen
Der Feedback-Vergleichsreport ermöglicht es, die Report-Ergebnisse nach den folgenden Dimensionen in der angegebenen Reihenfolge zu filtern.
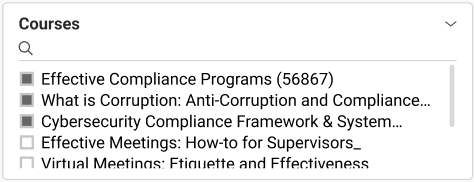
Diese Dimension listet alle Kurse auf, für die der Berichterstatter Zugriffsrechte hat.
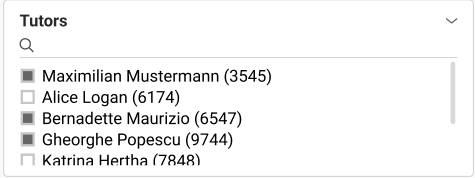
Diese Metrik listet alle Tutoren auf, denen in der Kursvorlage und in den Kursen, auf die der Berichtersteller Zugriffsrechte hat, die Tutorenrolle zugewiesen wurde.

Diese Dimension listet die Gruppen der Lernenden auf, die in den Kursen, auf die der Berichtersteller Zugriff hat, eingeschrieben sind, Fortschritte machen, nicht erfolgreich beendet haben, bestanden haben oder abgebrochen haben (nur wenn sie Feedback abgegeben haben). Durch die Auswahl eines Gruppenbaumelements werden auch die Untergruppen ausgewählt.

Diese Dimension listet alle Lernformen auf, die den Kursen zugewiesen sind, auf die der Berichtersteller Zugriffsrechte hat.

Diese Dimension listet alle Veranstalter auf, die den Kursen zugeordnet sind, für die der Berichterstatter Zugriffsrechte hat.
Metriken
Der Feedback-Vergleichsbericht ermöglicht es, die Report-Ergebnisse nach den folgenden Metriken in der angegebenen Reihenfolge zu filtern.
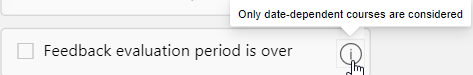
Wenn „Feedback-Bewertung ist abgelaufen“ ausgewählt ist, werden nur die Fragen aus den Feedback-Formularen berücksichtigt, die datumsabhängigen Kursen zugeordnet sind, für die die Feedback-Bewertung abgelaufen ist.
N/A wird angezeigt, wenn keine solche Feedback-Frage verfügbar ist.
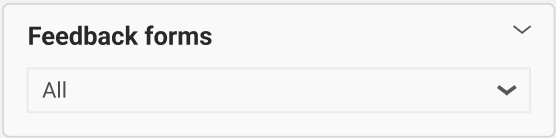
Diese Metrik listet alle Feedback-Formulare auf, die den Kursen zugeordnet sind, auf die der Berichterstatter Zugriffsrechte hat. Durch die Auswahl einer Feedbackvorlage werden auch alle aufgeführten Feedback-Formulare dieser Vorlage ausgewählt.
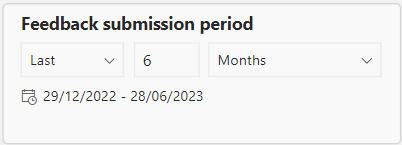
Diese Kennzahl filtert den Report nach dem gewünschten Zeitraum, in dem das Feedback eingereicht wurde. Der Standardzeitraum beträgt 6 Monate.
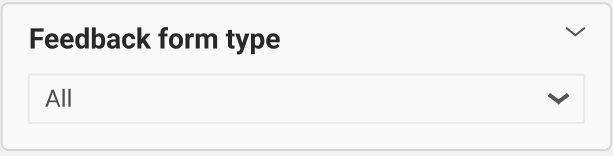
Diese Metrik filtert den Bericht nach dem gewünschten Feedbackformular-Typ (Standard, Übertragung) der Feedbackvorlagen und Feedbackformulare, die den Kursen zugewiesen sind, auf die der Nutzer Zugriff hat, sowie nach deren Kursvorlagen.

Diese Metrik listet alle Kursvorlagen der Kurse auf, für die der Berichterstatter Zugriffsrechte hat.